
























Printable Graph & Prose Worksheet | Grade 9 English I
Paste this activity's link or code into your existing LMS (Google Classroom, Canvas, Teams, Schoology, Moodle, etc.).
Students can open and work on the activity right away, with no student login required.
You'll still be able to track student progress and results from your teacher account.
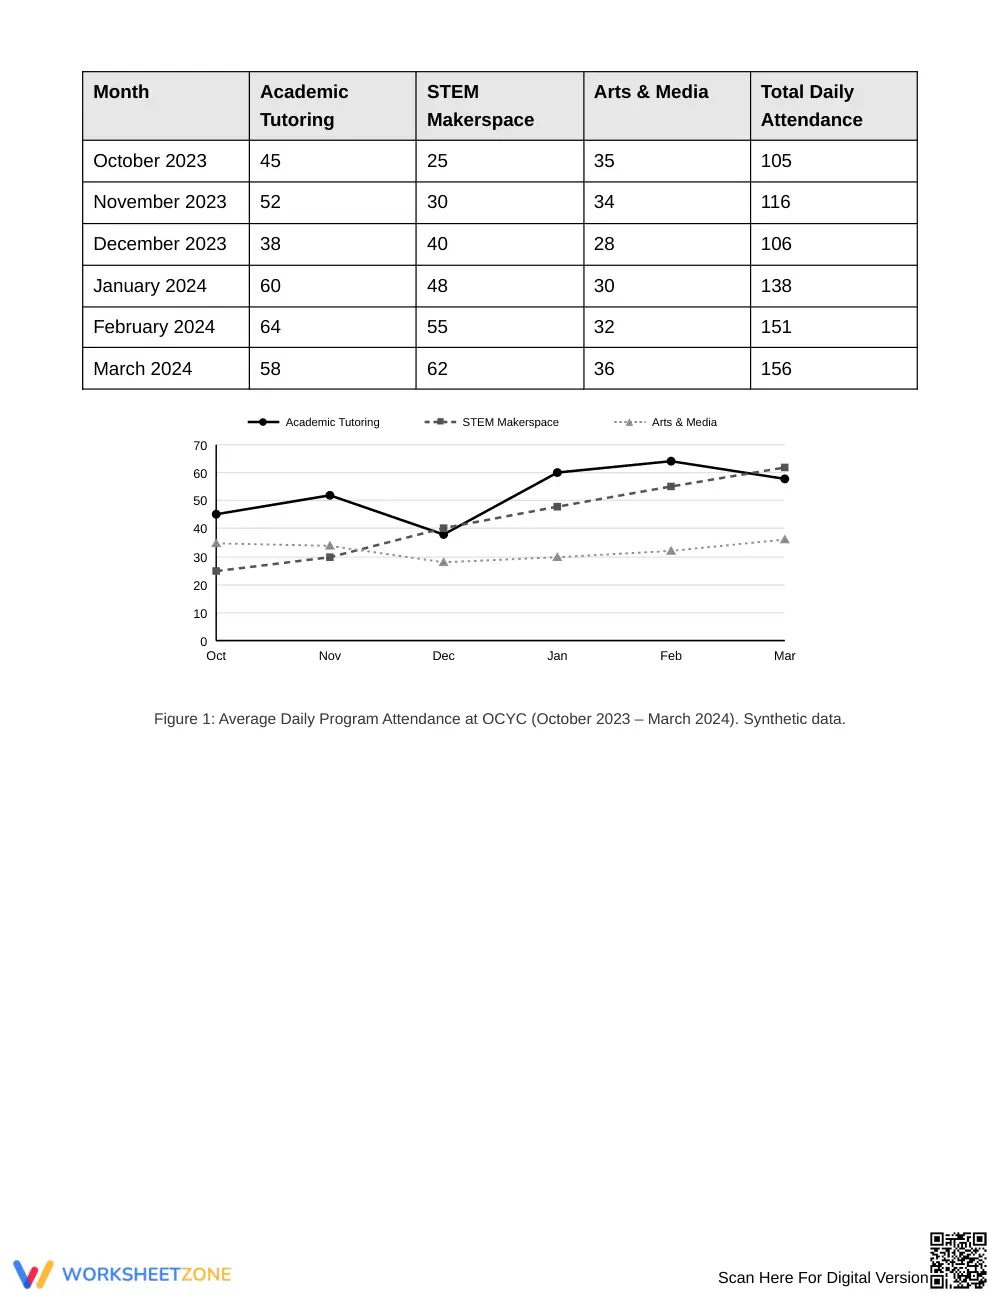
This Grade 9 English I worksheet trains students to interpret quantitative visual data alongside informational prose to evaluate trends and qualify claims. Students analyze a youth center report, comparing data in a table and line graph against qualitative explanations to resolve discrepancies and write evidence-based arguments.
At a Glance
- Grade: 9 · Subject: English I
- Standard:
RH.9-10.7— Integrate quantitative or technical analysis with qualitative textual descriptions and visual data displays.- Skill Focus: Interpret a Graph Alongside Informational Prose
- Format: 7 pages · 12 problems · Comprehensive answer key included · Printable PDF
- Best For: Informational text data integration unit practice
- Time: 45–60 minutes
What's Inside
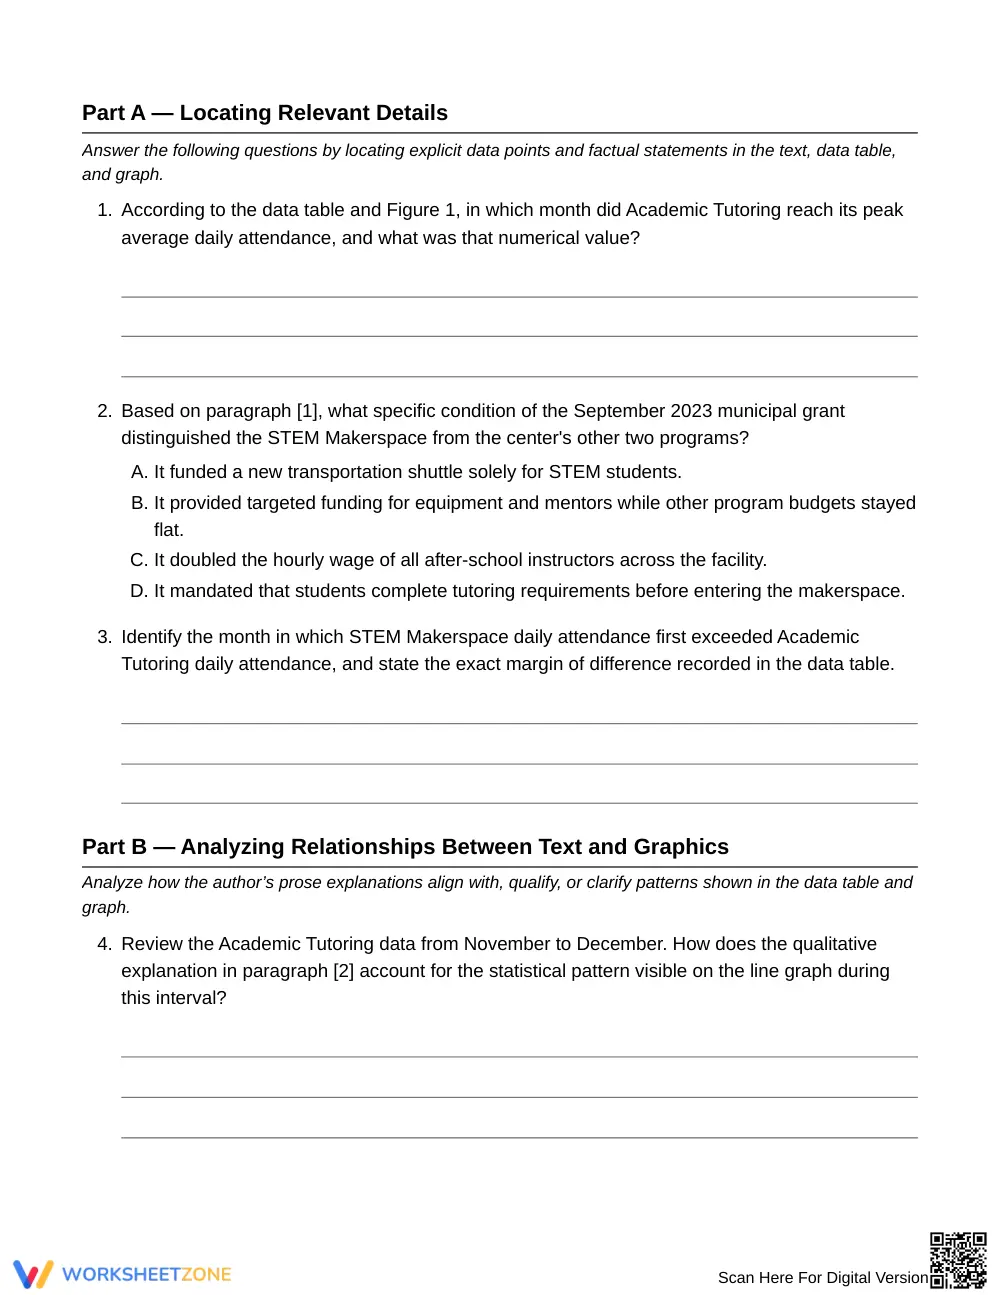
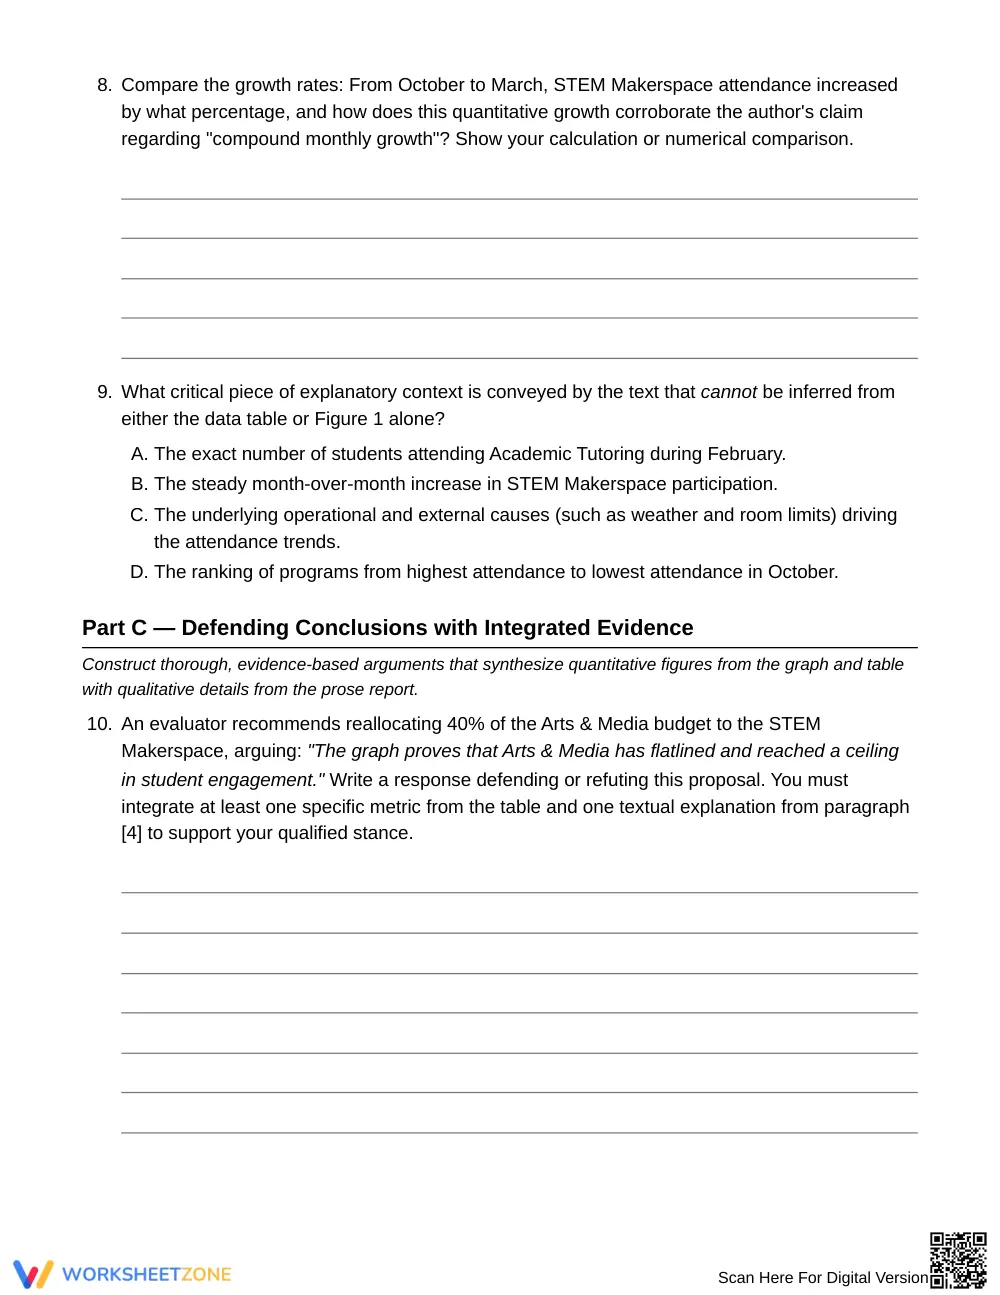
This 7-page resource features an authentic four-paragraph evaluation report paired with a summary data table and a comparative line graph. Students complete an introductory strategy box, 3 literal retrieval questions, 6 analytical text-to-graphic alignment tasks, and 3 multi-paragraph synthesis prompts. A complete 3-page teacher answer key provides explicit numerical solutions and model responses.
Skill Progression
- Guided practice (Part A — 3 problems): Students locate explicit data points and baseline metrics across the text, table, and graph.
- Supported practice (Part B — 6 problems): Learners examine how narrative context qualifies statistical trends, calculating growth and explaining anomalies.
- Independent practice (Part C — 3 problems): Students compose rigorous constructed responses and policy arguments synthesizing metrics with qualitative factors.
This sequence embodies a gradual-release model, shifting students systematically from guided identification to autonomous synthesis.
Standards Alignment
This worksheet is aligned to primary standard RH.9-10.7: Integrate quantitative or technical analysis with qualitative analysis in print text. It also reinforces supporting standard RI.9-10.7 by requiring students to integrate quantitative findings into written evaluations. Both standard codes can be copied directly into lesson plans, IEP goals, or district curriculum mapping tools.
How to Use It
Deploy this activity during guided practice following direct instruction on multimodal literacy, or assign it after teaching informational writing to reinforce evidence integration. As students work, observe whether they check qualitative constraints before drafting Part C arguments. Most learners complete the 12 problems in 45 to 60 minutes.
Who It's For
This resource serves Grade 9 English I students mastering graphics integration, high school civics classes analyzing reports, and English learners needing visual scaffolds. Striving readers benefit from the Part A retrieval items, while advanced writers tackle the Part C policy evaluation. It pairs effectively with an anchor chart on evaluating quantitative data.
Mastering standard RH.9-10.7 requires secondary students to interpret a graph alongside prose, reconciling numerical metrics with narrative context. According to Fisher & Frey (2014), gradual-release instructional designs that guide students from structured data extraction to independent cross-textual synthesis significantly enhance disciplinary literacy and critical evaluation. When high school learners encounter paired informational displays, they frequently struggle to reconcile statistical anomalies against qualitative explanations without explicit instructional routines. This 12-task worksheet directly addresses that barrier by scaffolding analytical progression across three discrete phases: locating explicit data values, examining how prose narratives qualify quantitative shifts, and constructing reasoned, evidence-based policy defenses. By requiring students to defend conclusions using both statistical charts and contextual prose, this resource builds the analytical discernment necessary for rigorous high school reading assessments and evidence-based analytical writing across secondary English language arts curricula.


