
























Printable Graph Interpretation | Grade 9‑12 Science
Paste this activity's link or code into your existing LMS (Google Classroom, Canvas, Teams, Schoology, Moodle, etc.).
Students can open and work on the activity right away, with no student login required.
You'll still be able to track student progress and results from your teacher account.
Students will master interpreting scientific graphs and evidence about carbon cycles, using data to explain atmospheric CO₂ trends and model fluxes. This worksheet guides them through calculations, explanations, and evaluations that build confidence in reading complex environmental data and connecting it to particle and atomic models.
At a Glance
- Grade: 9‑12 high school students · Subject: Science
- Standard: — Students interpret graphs and evidence to explain carbon cycle processes
- Skill Focus: Graph & evidence interpretation for integrated science cycles
- Format: 4 pages · 19 problems · Answer key included · PDF
- Best For: Classroom data analysis & environmental science lessons
- Time: 45–60 minutes
What's Inside
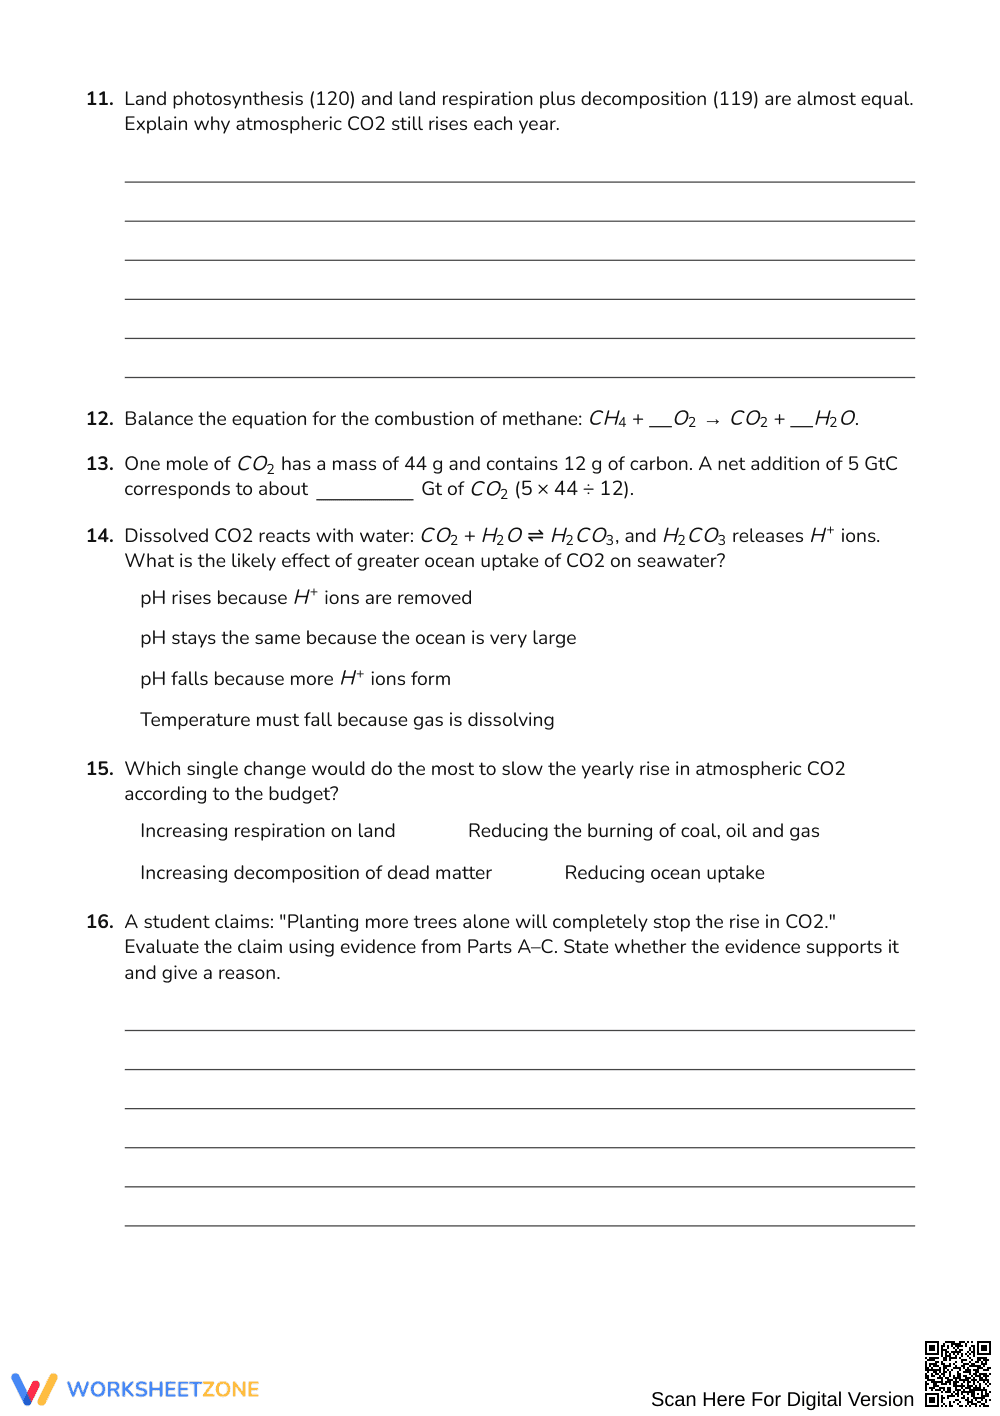
Inside the four‑page packet, students encounter 19 tasks ranging from data‑reading questions and rate calculations to model‑budget analysis and chemical equation balancing. An answer key follows the worksheet, and each part includes clear worked examples, sentence frames, and a word bank for scientific terminology.
Skill Progression
- Guided practice (6 problems): Students work through rate‑change calculations with a step‑by‑step scaffold and word bank.
- Supported practice (7 problems): Students interpret seasonal CO₂ tables and explain processes using sentence frames.
- Independent practice (6 problems): Students analyze the carbon‑budget model and evaluate claims with minimal prompts.
These steps follow the I Do, We Do, You Do gradual‑release framework.
Standards Alignment
Although no specific code is listed, this worksheet aligns with the integrated science standards that require learners to interpret graphs and evidence to explain carbon‑cycle processes and to connect particle‑level models with macroscopic changes. It also supports cross‑cutting concepts of energy and matter flow. Both standard references can be copied directly into lesson plans, IEP goals, or district curriculum mapping tools.
How to Use It
Before a unit on climate change, teachers can assign Part A as a pre‑assessment to gauge students’ ability to calculate rates and identify trends.
During the unit, Part C serves as a formative check after instruction on carbon budgeting; teachers observe students’ explanations of the claim about tree planting and note misconceptions.
A quick teacher observation note can capture whether the evidence supports or refutes the claim.
Typical completion time ranges from 45 to 60 minutes.
Who It's For
Designed for high‑school science students (grades 9‑12), the worksheet supports all learners; advanced students can tackle the extension questions in Part C, while teachers may provide additional scaffolds for struggling readers. Pair it with a carbon‑cycle anchor chart or a short video on atmospheric CO₂ for a cohesive lesson.
Research shows that explicit data‑interpretation practice improves scientific reasoning (Fisher & Frey 2014). This Grade 9‑12 Science worksheet targets the skill of interpreting graphs and evidence for integrated science cycles, requiring students to calculate rates, explain seasonal patterns, and evaluate carbon‑budget claims. By embedding worked examples and sentence frames, the tasks align with evidence‑based instruction that promotes deeper conceptual understanding. The inclusion of real‑world CO₂ data connects classroom learning to pressing environmental issues, reinforcing the relevance of particle and atomic models. Teachers can readily assign the printable PDF, collect responses, and use the answer key for immediate feedback, supporting formative assessment cycles. Students who engage with authentic climate data demonstrate higher retention of core concepts, and the worksheet’s progressive structure mirrors the gradual‑release model, moving from teacher‑led examples to independent analysis. This alignment with research‑backed practices ensures that classroom time is used efficiently while fostering scientific literacy.


