


0
Views
0
Downloads
0.0
0
Save
0 Likes
Bar Graph Data Analysis Worksheet
0 Views
0 Downloads
Paste this activity's link or code into your existing LMS (Google Classroom, Canvas, Teams, Schoology, Moodle, etc.).
Students can open and work on the activity right away, with no student login required.
You'll still be able to track student progress and results from your teacher account.
Information
Description
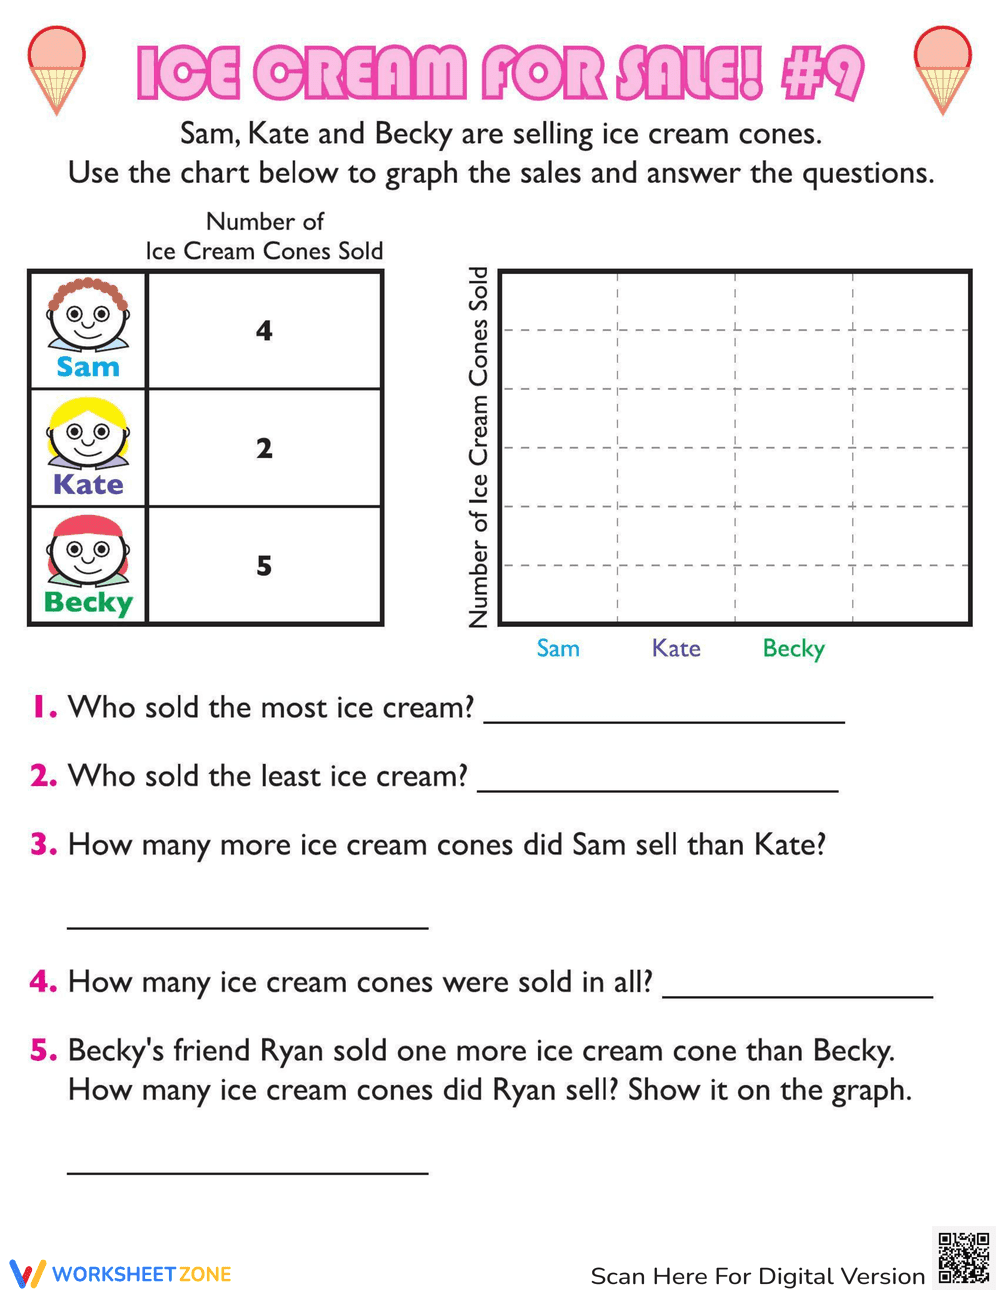
What It Is:
This is an educational worksheet titled 'Ice Cream for Sale! #9'. It involves reading data from a table showing the number of ice cream cones sold by Sam (4), Kate (2), and Becky (5). Students are instructed to graph this data on a provided blank bar graph and then answer five related word problems involving comparing and adding the sales figures. The final problem requires students to calculate Ryan's sales (based on Becky's sales) and represent that on the graph as well.
Grade Level Suitability:
This worksheet is suitable for grades 1-3. It reinforces basic graphing skills, data interpretation, addition, and subtraction, which are typically taught in these grades. The word problems are simple and directly related to the data presented.
Why Use It:
This worksheet helps students develop data analysis and graphing skills. It provides practice in interpreting data from a table, creating a bar graph, and solving simple addition and subtraction word problems based on the data. It also enhances problem-solving skills and reinforces the connection between data representation and real-world scenarios.
How to Use It:
First, guide students to transfer the data from the table (Sam: 4, Kate: 2, Becky: 5) onto the blank bar graph, creating bars of the appropriate height for each person. Then, have them answer the five questions by performing calculations or reading the graph. For the final question, they need to calculate Ryan's sales (Becky's sales + 1) and add Ryan's bar to the graph.
Target Users:
This worksheet is ideal for elementary school students in grades 1-3 who are learning about data analysis, graphing, and basic arithmetic. It is also suitable for teachers looking for engaging and practical worksheets to reinforce these concepts in their classrooms.