


Views
Downloads
Printable Plant Life Cycle Diagram | Grade 3 Science
Paste this activity's link or code into your existing LMS (Google Classroom, Canvas, Teams, Schoology, Moodle, etc.).
Students can open and work on the activity right away, with no student login required.
You'll still be able to track student progress and results from your teacher account.
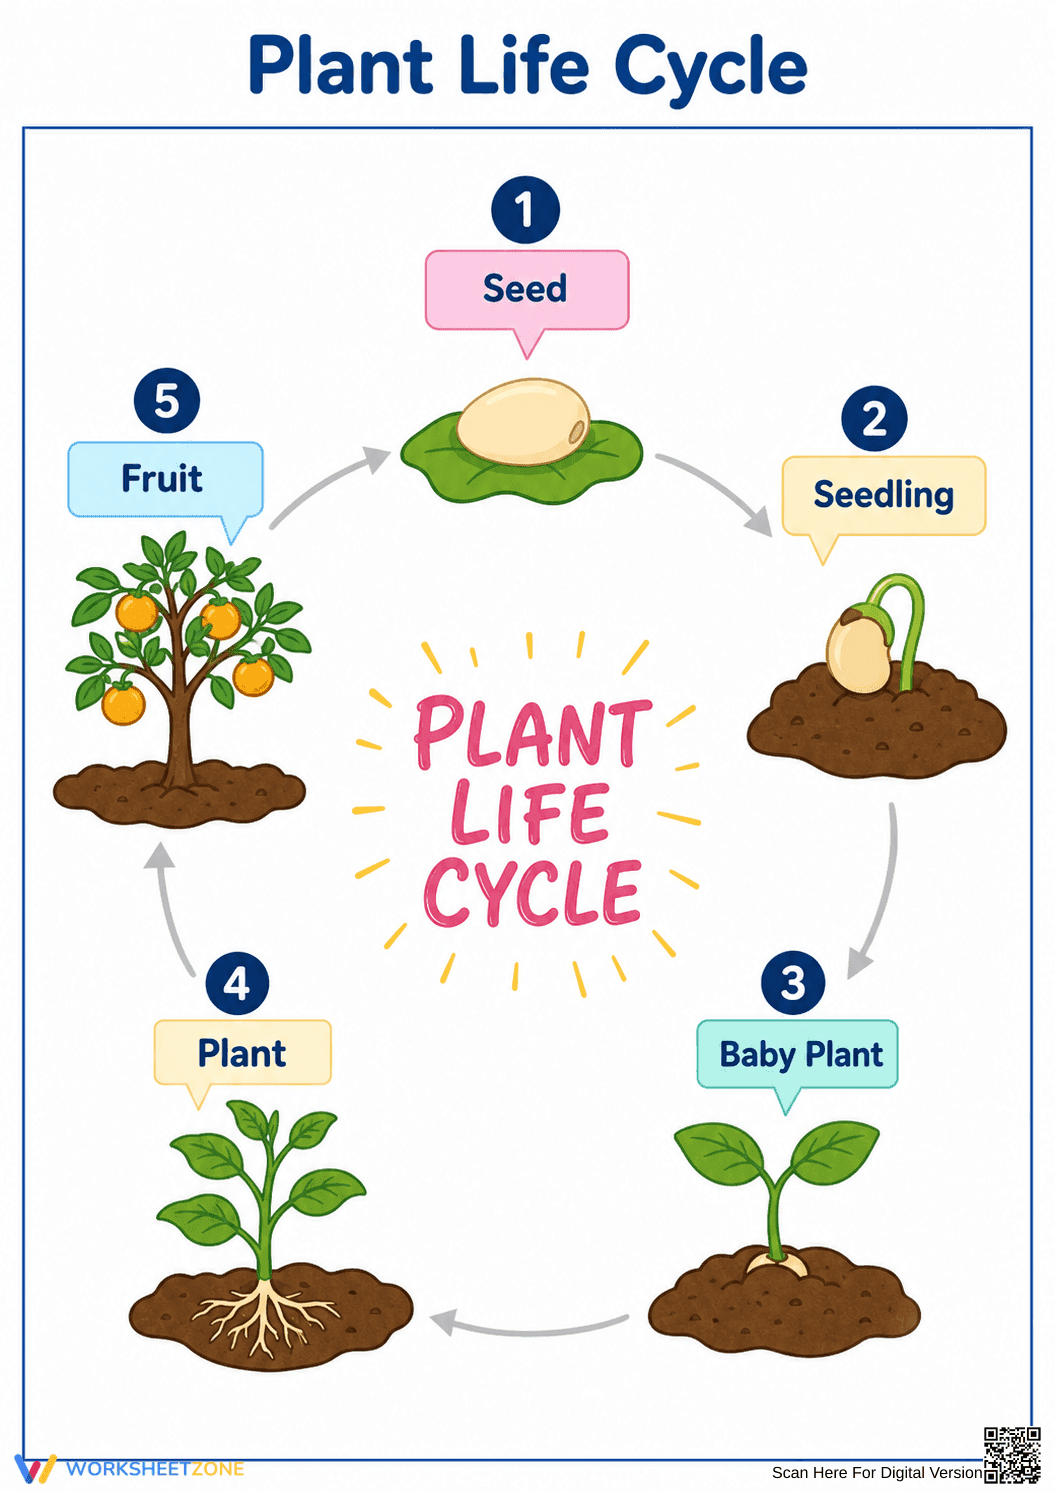
This visual plant life cycle diagram helps Grade 3 and 4 students understand how organisms grow and reproduce. By examining the five distinct stages from seed to fruit, learners build foundational biology knowledge. Use this clear, engaging resource to introduce life science concepts effectively in your classroom.
At a Glance
- Grade: 3 · Subject: Science
- Standard:
3-LS1-1— Describe unique and diverse organism life cycles- Skill Focus: Plant life cycle stages
- Format: 1 page · 5 stages · No answer key needed · PDF
- Best For: Anchor chart or reference
- Time: 5–10 minutes
This single-page resource features a fully illustrated, circular diagram detailing the five key phases of a fruit-bearing plant's development. Students trace the progression from seed, to seedling, baby plant, mature plant, and fruit. The clear visual layout makes it an excellent reference tool, requiring no additional answer key or complex instructions.
This resource is designed for immediate classroom implementation with a streamlined zero-prep workflow:
- Print (1 minute): Simply download the PDF and print copies for student folders or a large version for your science wall.
- Distribute (1 minute): Hand out the diagram at the start of your biology unit as a foundational reference sheet.
- Review (3 minutes): Walk through the five stages together, pointing out the arrows that indicate the continuous cycle.
Total teacher prep time is under two minutes, making it an ideal, stress-free addition to any lesson plan or substitute teacher binder.
This diagram aligns directly with Next Generation Science Standards, specifically 3-LS1-1: Develop models to describe that organisms have unique and diverse life cycles but all have in common birth, growth, reproduction, and death. By visualizing the continuous loop from seed to fruit, students grasp the core concept of biological reproduction and growth. Both standard codes can be copied directly into lesson plans, IEP goals, or district curriculum mapping tools.
Introduce this diagram before direct instruction to activate prior knowledge and give students a visual roadmap of the upcoming unit. Alternatively, use it during a hands-on seed planting activity; have students reference the chart to predict what their real-life seeds will look like in the coming weeks. For a quick formative assessment, cover the text labels with sticky notes and ask students to verbally identify each stage based on the illustrations. Expected review time is 5 to 10 minutes.
This resource is primarily designed for third and fourth-grade science students beginning their life science units. The highly visual nature of the diagram provides excellent differentiation for English Language Learners (ELLs) and students who benefit from visual aids over text-heavy explanations. It pairs perfectly with a hands-on bean planting activity or a non-fiction reading passage about photosynthesis and plant growth.
Understanding biological progressions through visual models is a critical component of early science education. This resource supports standard 3-LS1-1 by helping students describe unique and diverse organism life cycles. According to a ScienceDirect TpT Analysis, integrating clear, sequential diagrams into elementary science instruction significantly improves long-term retention of complex biological processes. When students visually trace the path from seed to fruit, they develop a stronger conceptual framework for understanding growth and reproduction. Visual aids reduce cognitive load, allowing young learners to focus on relationships between developmental stages rather than struggling with dense vocabulary. By providing this structured model, educators foster deeper scientific inquiry and ensure foundational concepts are firmly established before moving to advanced topics. This evidence-based approach ensures that all learners can access the curriculum effectively.