


Views
Downloads
Grade 2 Bar Graphs & Coordinates | Essential Math
Paste this activity's link or code into your existing LMS (Google Classroom, Canvas, Teams, Schoology, Moodle, etc.).
Students can open and work on the activity right away, with no student login required.
You'll still be able to track student progress and results from your teacher account.
This Grade 2 math assessment provides a comprehensive review of data representation and introductory geometry. Students practice collecting data from a visual set, constructing a functional bar graph, and interpreting results through comparative analysis. The second half introduces spatial reasoning via coordinate identification on a Cartesian plane, ensuring a well-rounded evaluation of term-four mathematical objectives.
At a Glance
- Grade: 2 · Subject: Math
- Standard:
CCSS.MATH.CONTENT.2.MD.D.10— Draw a bar graph to represent data and solve comparison problems- Skill Focus: Data Interpretation & Coordinate Planes
- Format: 2 pages · 9 problems · Answer key included · PDF
- Best For: End-of-term summative assessment or review
- Time: 20–30 minutes
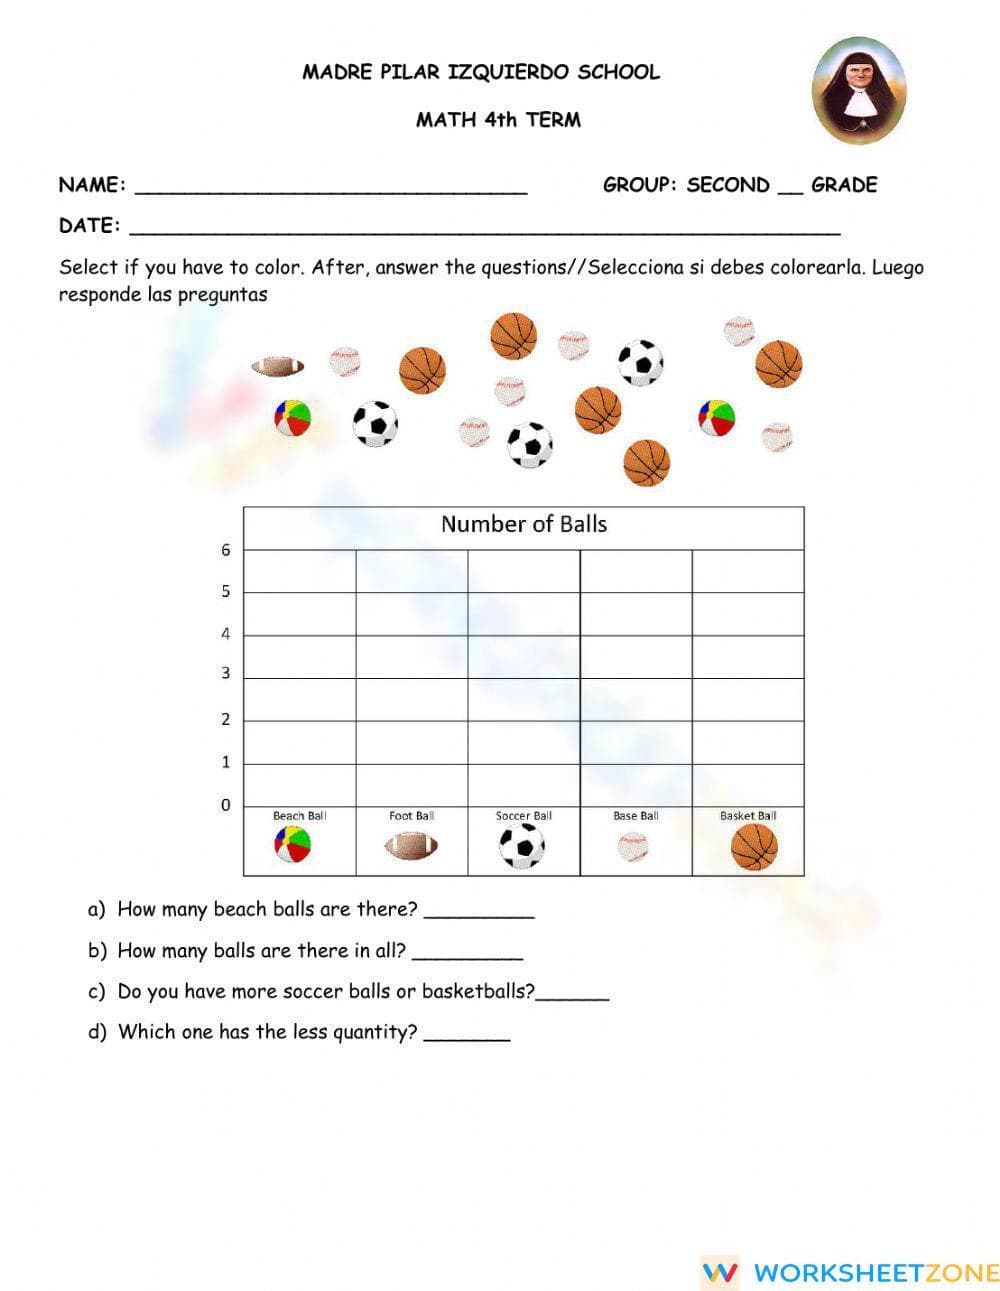
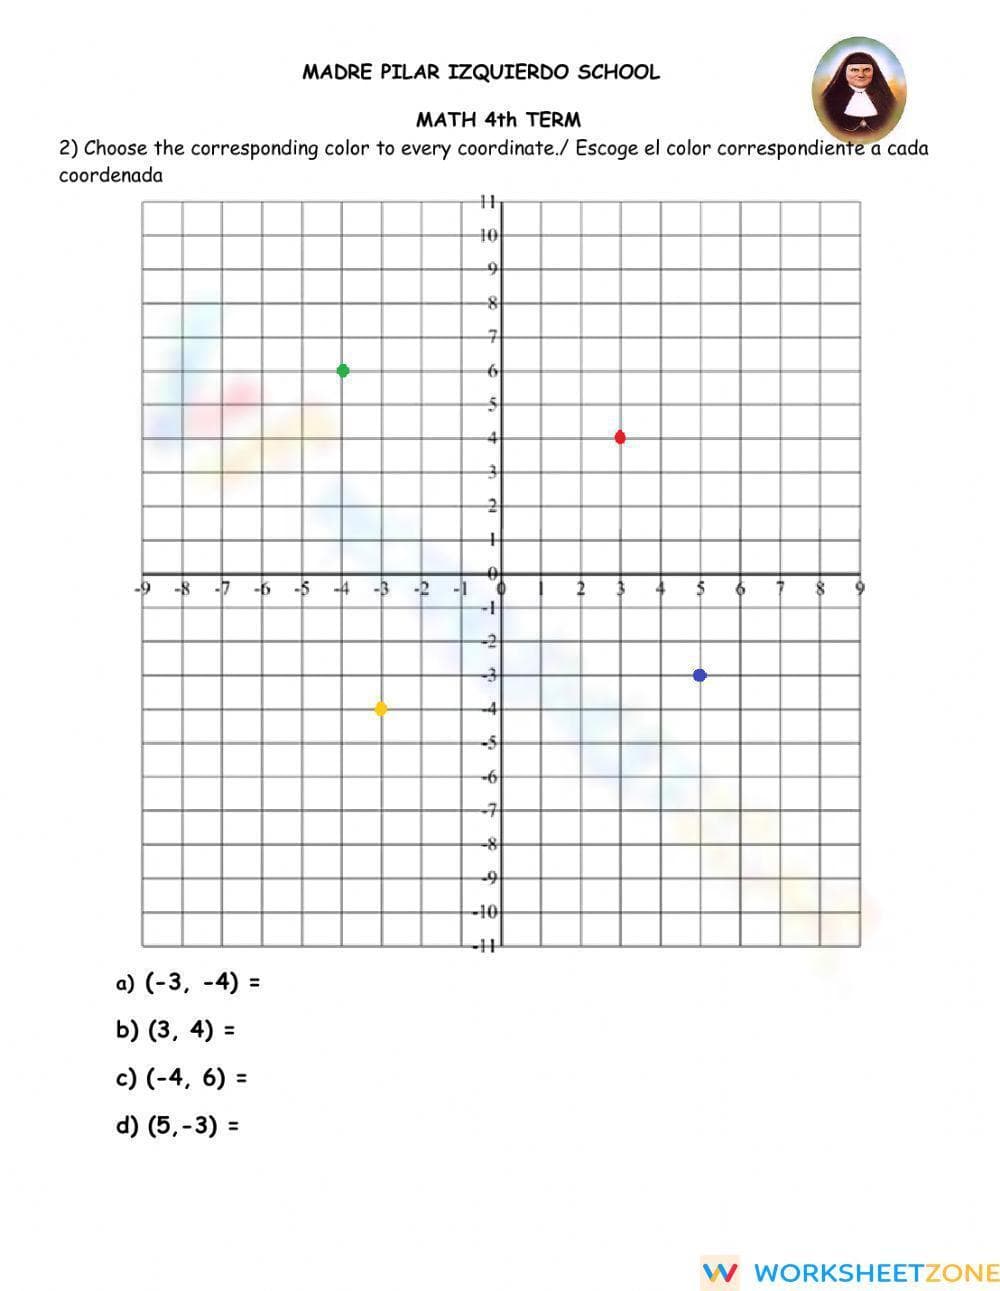
What’s Inside: This 2-page PDF features a structured layout designed for independent student work. Page one includes a data set of various sports balls, a blank bar graph template with a scale of 0-6, and four analytical questions. Page two presents a full four-quadrant Cartesian plane with color-coded points, requiring students to match specific (x, y) coordinates to their corresponding colors. The worksheet includes bilingual instructions to support diverse learners.
Zero-Prep Workflow
- Print: Generate copies of the 2-page assessment for your class in under 30 seconds.
- Distribute: Hand out the sheets and provide a brief overview of the graphing and coordinate tasks (1 minute).
- Review: Use the included answer key to grade the 9 tasks or facilitate a peer-review session (5 minutes).
This streamlined process makes the resource an excellent choice for busy end-of-term periods or as a high-quality emergency sub plan.
Standards Alignment: The primary focus is `CCSS.MATH.CONTENT.2.MD.D.10`, which requires students to draw a bar graph to represent a data set with up to four categories and solve simple put-together and compare problems. Additionally, the coordinate section introduces concepts found in `CCSS.MATH.CONTENT.5.G.A.1`, adapted for early geometric exposure. Both standard codes can be copied directly into lesson plans, IEP goals, or district curriculum mapping tools.
How to Use It: Assign this worksheet as a summative assessment at the end of a graphing unit to measure mastery. During the activity, observe if students correctly align the bars with the numerical scale on the y-axis, which serves as a vital formative assessment indicator. Expect students to complete both pages within a 20 to 30-minute window depending on their familiarity with grid navigation.
Who It's For: This resource is tailored for second-grade students but serves as an effective challenge for first graders or a remedial review for third graders. It pairs naturally with an anchor chart on data types or a direct instruction lesson on the X and Y axes. The clear visual aids make it accessible for students requiring spatial scaffolds.
Research from Fisher & Frey (2014) emphasizes the importance of visual representations in mathematical literacy. This worksheet targets CCSS.MATH.CONTENT.2.MD.D.10 by requiring students to translate raw counts into a structured bar graph and interpret the results through comparative questioning. By integrating coordinate geometry, the resource bridges the gap between simple data collection and spatial reasoning. According to the NAEP, students who engage with multiple forms of data representation early in their education show higher proficiency in algebraic thinking in later grades. This 2-page assessment provides a clear snapshot of student mastery in both categorical data and basic grid navigation, making it a reliable tool for end-of-term evaluations or progress monitoring. The dual-language instructions further support English Language Learners in mastering technical mathematical vocabulary within a familiar context.