




























Views
Downloads

Essential Solubility Curve Worksheet | Grades 9-12 Science

Paste this activity's link or code into your existing LMS (Google Classroom, Canvas, Teams, Schoology, Moodle, etc.).
Students can open and work on the activity right away, with no student login required.
You'll still be able to track student progress and results from your teacher account.
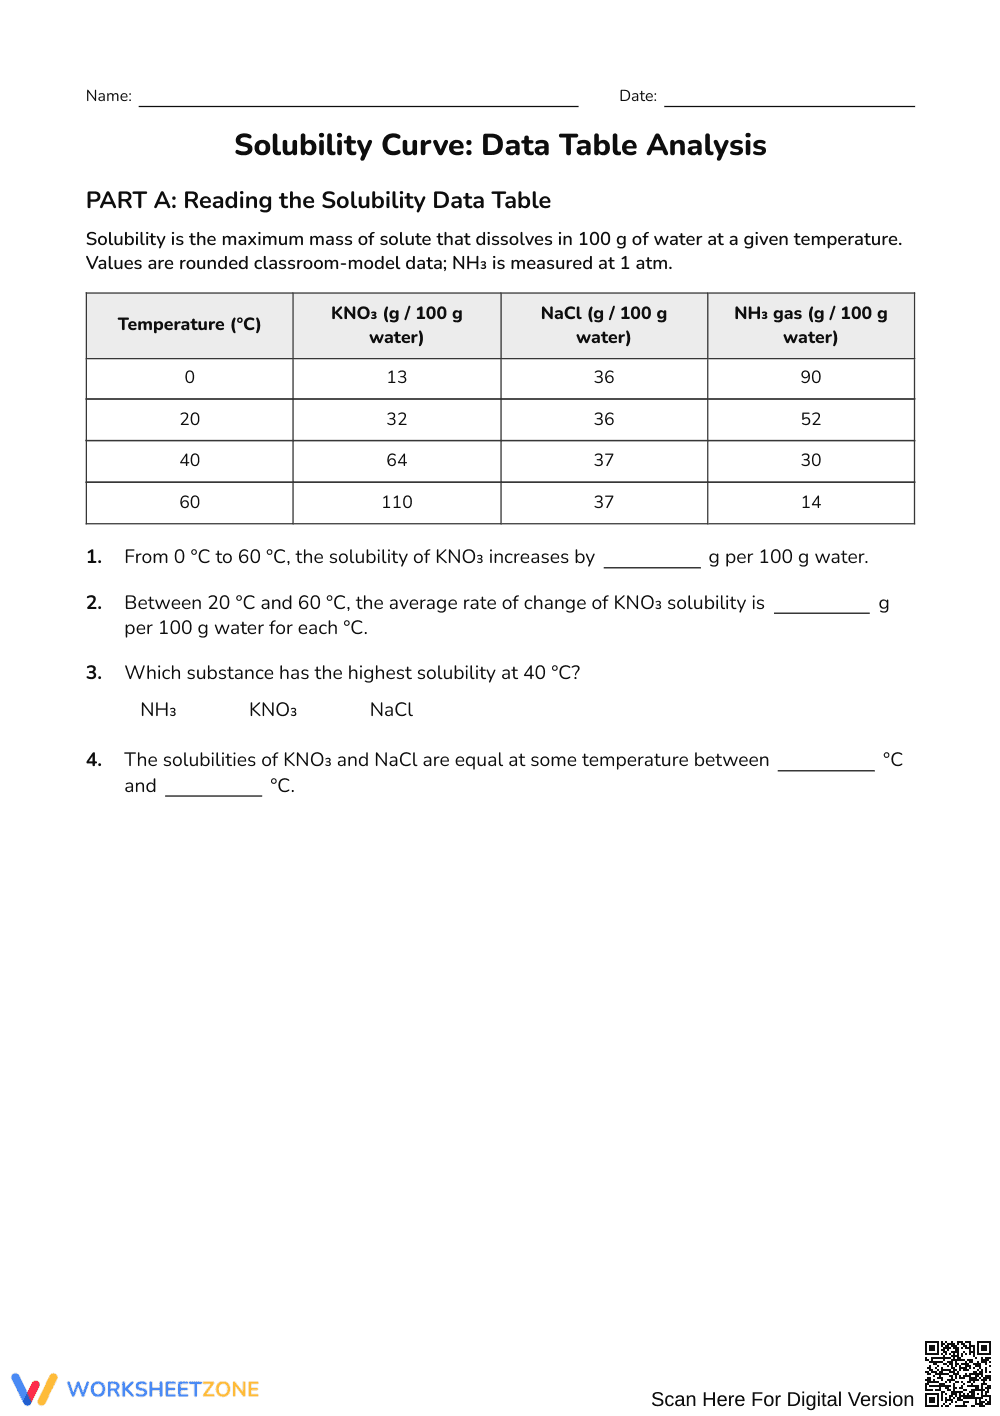
This 4-page chemistry worksheet provides 22 structured tasks to master solubility curve analysis, data interpretation, and evidence-based reasoning. Students read tabular solubility data, determine saturation levels across temperatures, calculate crystallization yields, and connect solubility trends to particle-level kinetic energy and intermolecular attractions.
At a Glance
- Grade: Grades 9–12 · Subject: Science
- Standard: High School Chemistry — Analyze and interpret data to explain substance solubility across changing temperatures
- Skill Focus: Solubility curve data table analysis and scientific explanations
- Format: 4 pages · 22 problems · Answer key included · PDF
- Best For: High school chemistry solution units and crystallization practice
- Time: 45–60 minutes
What's Inside
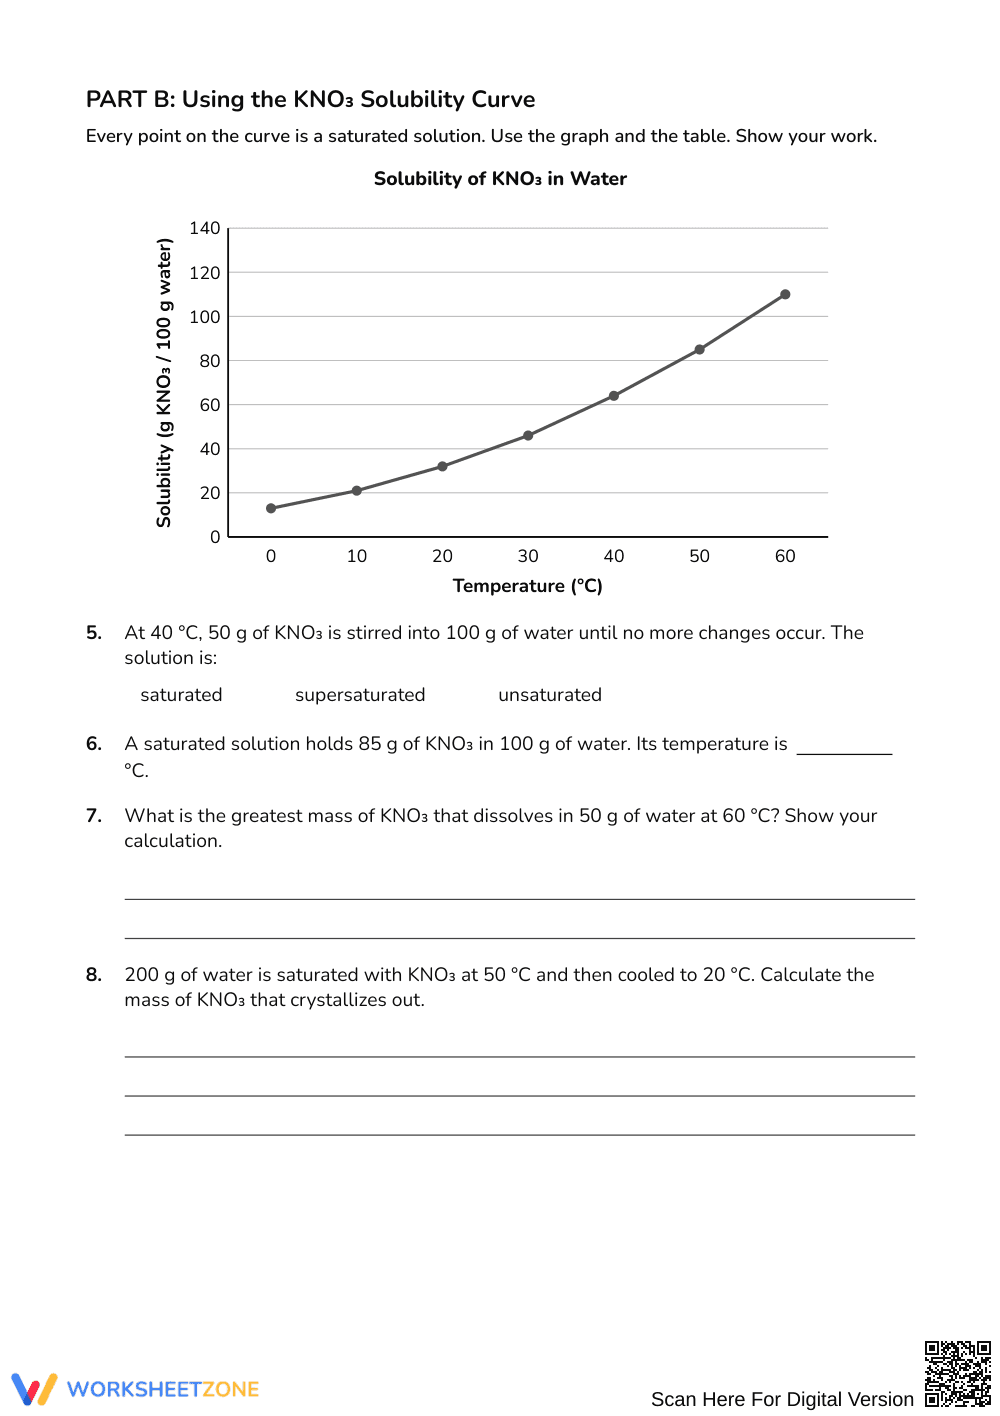
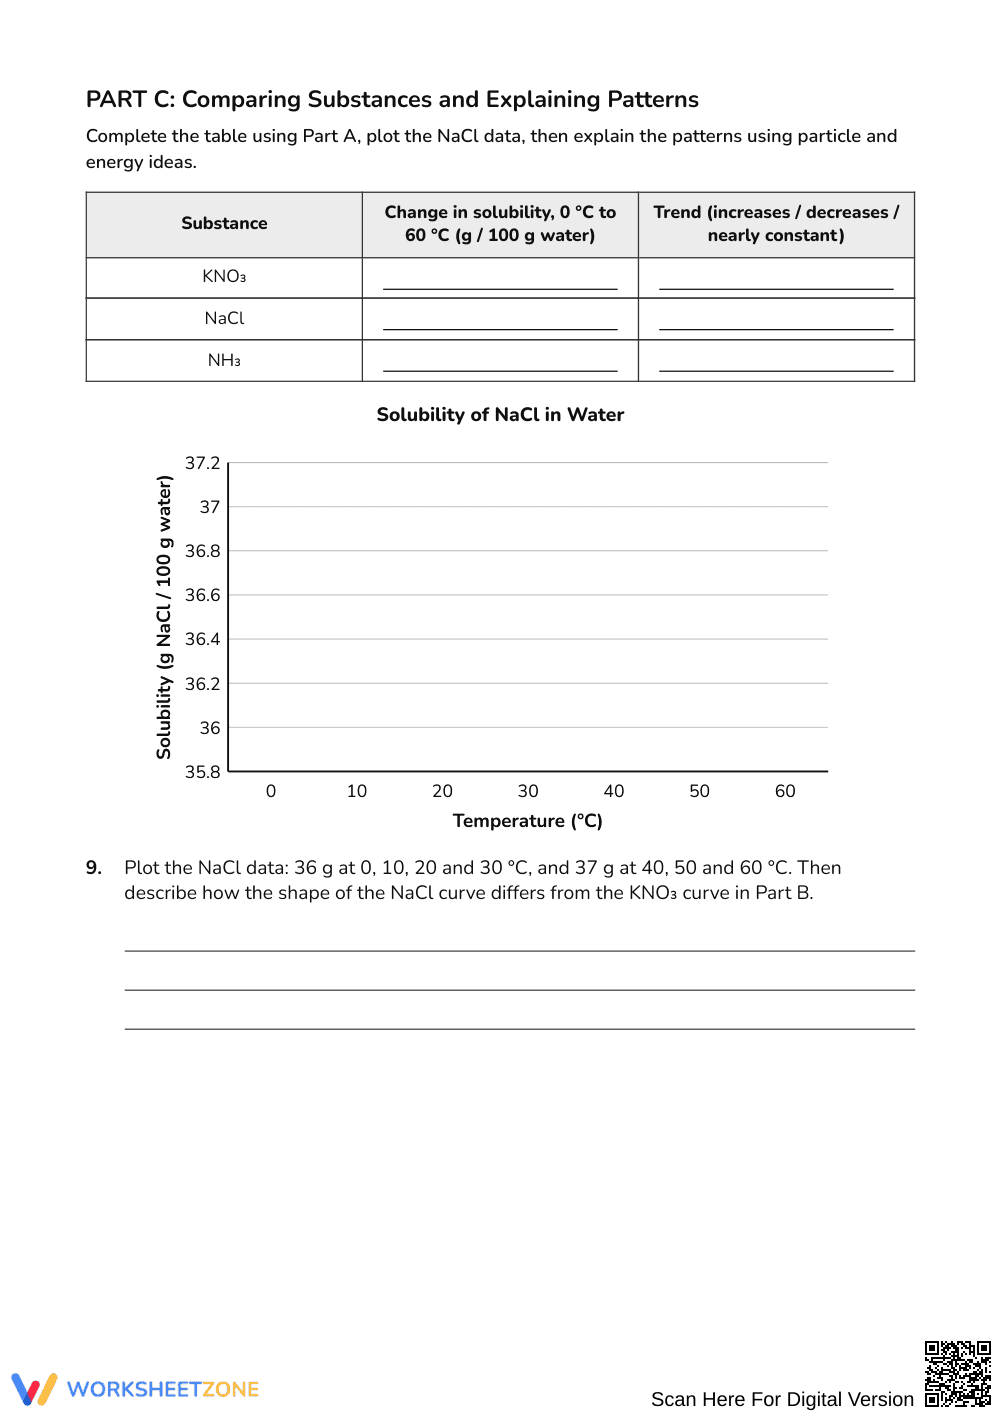
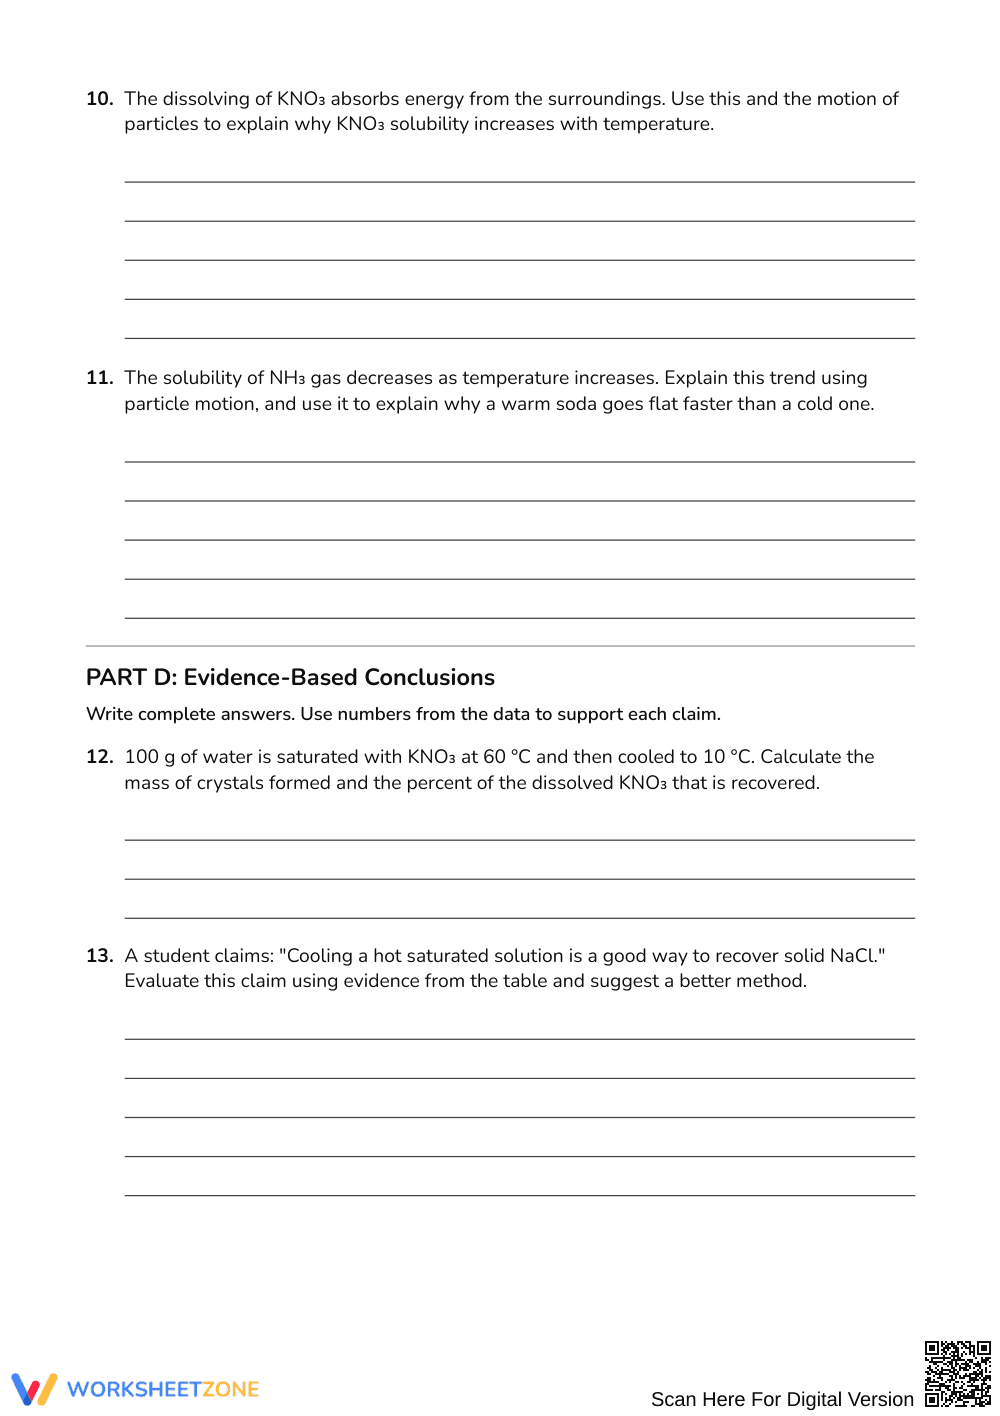
This resource spans 4 instructional pages containing 22 focused problems organized into four distinct parts. It features reference tables for potassium nitrate, sodium chloride, and ammonia gas alongside graphical curve models. Students solve quantitative mass-ratio problems, classify saturation, plot NaCl points, and answer free-response questions. A full 4-page answer key provides worked mathematical solutions and particle explanations.
Skill Progression
- Guided practice (Part A): Students read solubility tables, compute rates of change, and identify baseline values using reference definitions.
- Supported practice (Parts B & C): Students identify saturation thresholds, calculate solute masses for 50 g of water, graph NaCl data, and link particle energy to dissolution.
- Independent practice (Part D): Students independently calculate crystallization yields, determine recovery percentages, and evaluate experimental claims using quantitative data.
This gradual-release structure moves students smoothly from guided table analysis to independent reasoning using the I Do, We Do, You Do model.
Standards Alignment
This activity aligns with high school physical science standards requiring students to analyze and interpret data on chemical properties and interactions. Students evaluate quantitative patterns in solubility across temperatures to explain how thermal energy affects dissolution and gas escape. These curriculum standards can be copied directly into lesson plans, IEP goals, or district curriculum mapping tools.
How to Use It
Deploy this worksheet during the practice phase of a solutions unit following direct instruction on saturation curves. For formative assessment, check Part B calculations to verify whether students correctly scale solute mass for 50 g of water before attempting crystallization problems. Completion requires approximately 45 to 60 minutes.
Who It's For
This worksheet serves general chemistry, physical science, and introductory AP Chemistry students studying solution behavior. Clear reference tables support struggling learners, while multi-step crystallization math extends advanced students. Pair this activity with an interactive solubility curve demonstration or a hands-on crystallization lab.
Mastering solubility curve analysis and data table interpretation enables high school chemistry students to connect macroscopic observations with underlying submicroscopic thermodynamic processes. According to Fisher & Frey (2014), structuring science tasks through intentional gradual release helps students transition from basic graph reading to synthesizing complex evidence-based explanations. This instructional resource operationalizes that approach across 22 targeted problems, prompting learners to extract saturation thresholds, evaluate endothermic lattice separation, and quantify crystallization yields. When secondary students evaluate contrasting solute curves, such as steep ionic increases versus declining gas solubility, they develop the quantitative fluency highlighted across national science performance frameworks. By requiring learners to defend separation methods with numerical evidence rather than rote memorization, this structured instructional sequence builds durable data analysis capabilities essential for subsequent laboratory investigations in chemical equilibria, solution stoichiometry, and thermodynamic equilibrium.


