































Essential Element Trends Worksheet | Grades 9-12 Science

Paste this activity's link or code into your existing LMS (Google Classroom, Canvas, Teams, Schoology, Moodle, etc.).
Students can open and work on the activity right away, with no student login required.
You'll still be able to track student progress and results from your teacher account.
This high school chemistry worksheet strengthens students' ability to interpret scientific graphs, atomic models, and empirical data to explain periodic trends. Learners analyze ionization energy patterns across periods, classify unknown elements from lab evidence, and construct scientific explanations linking atomic structure to elemental reactivity.
At a Glance
- Grade: Grades 9–12 · Subject: Science
- Standard: Interpret data, periodic trends, and atomic models to explain chemical properties
- Skill Focus: Graph interpretation, element identification, and ionization energy modeling
- Format: 4 pages · 19 problems · Answer key included · PDF
- Best For: Periodic table evidence interpretation units
- Time: 45–60 minutes
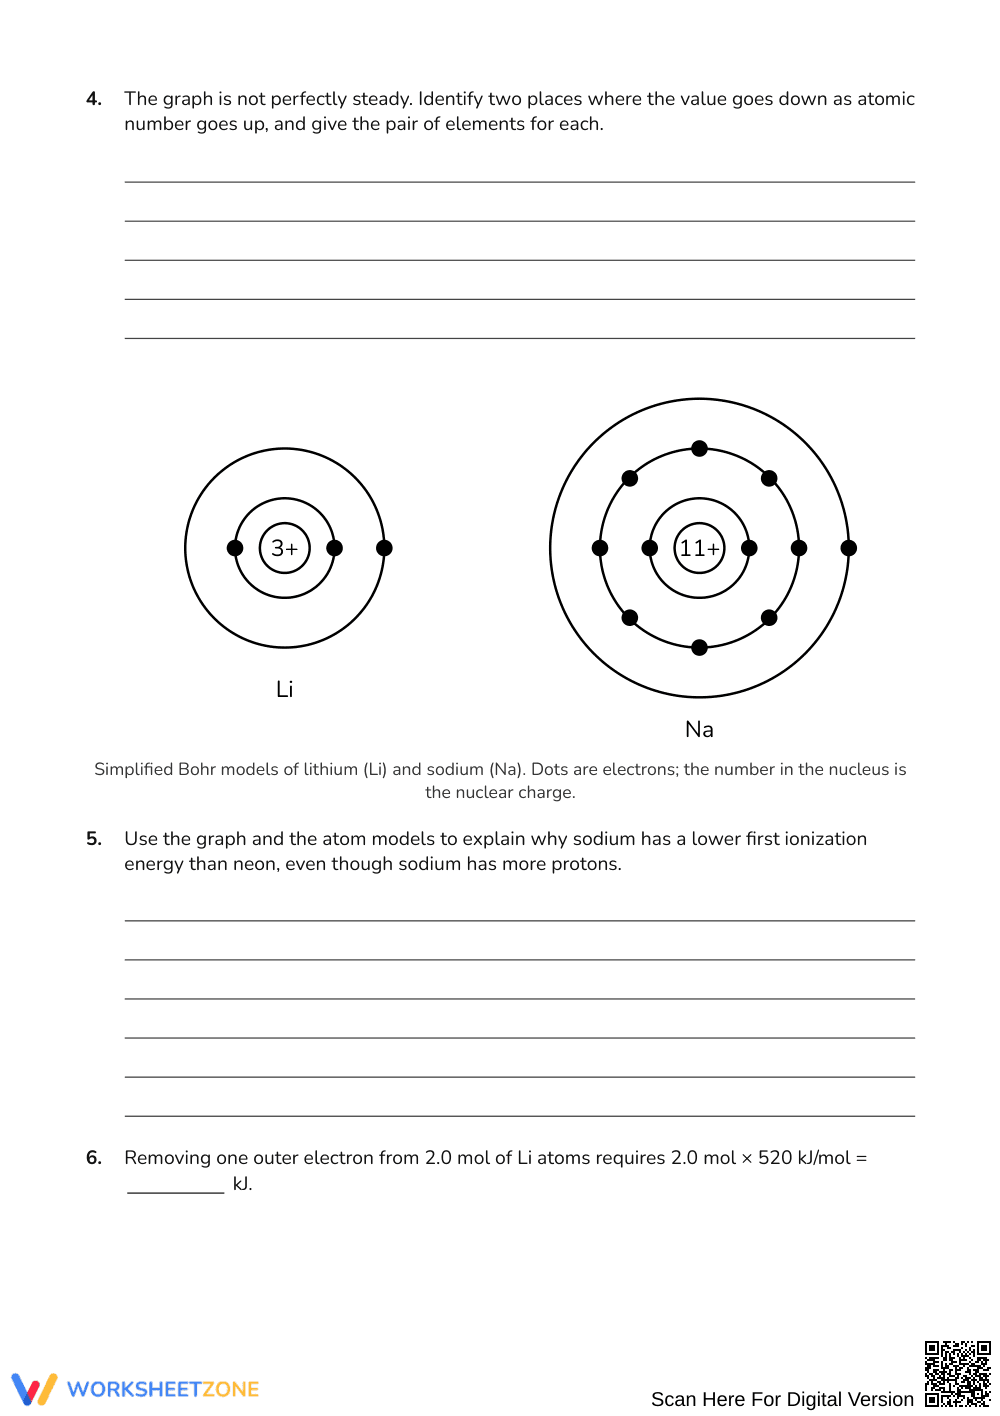
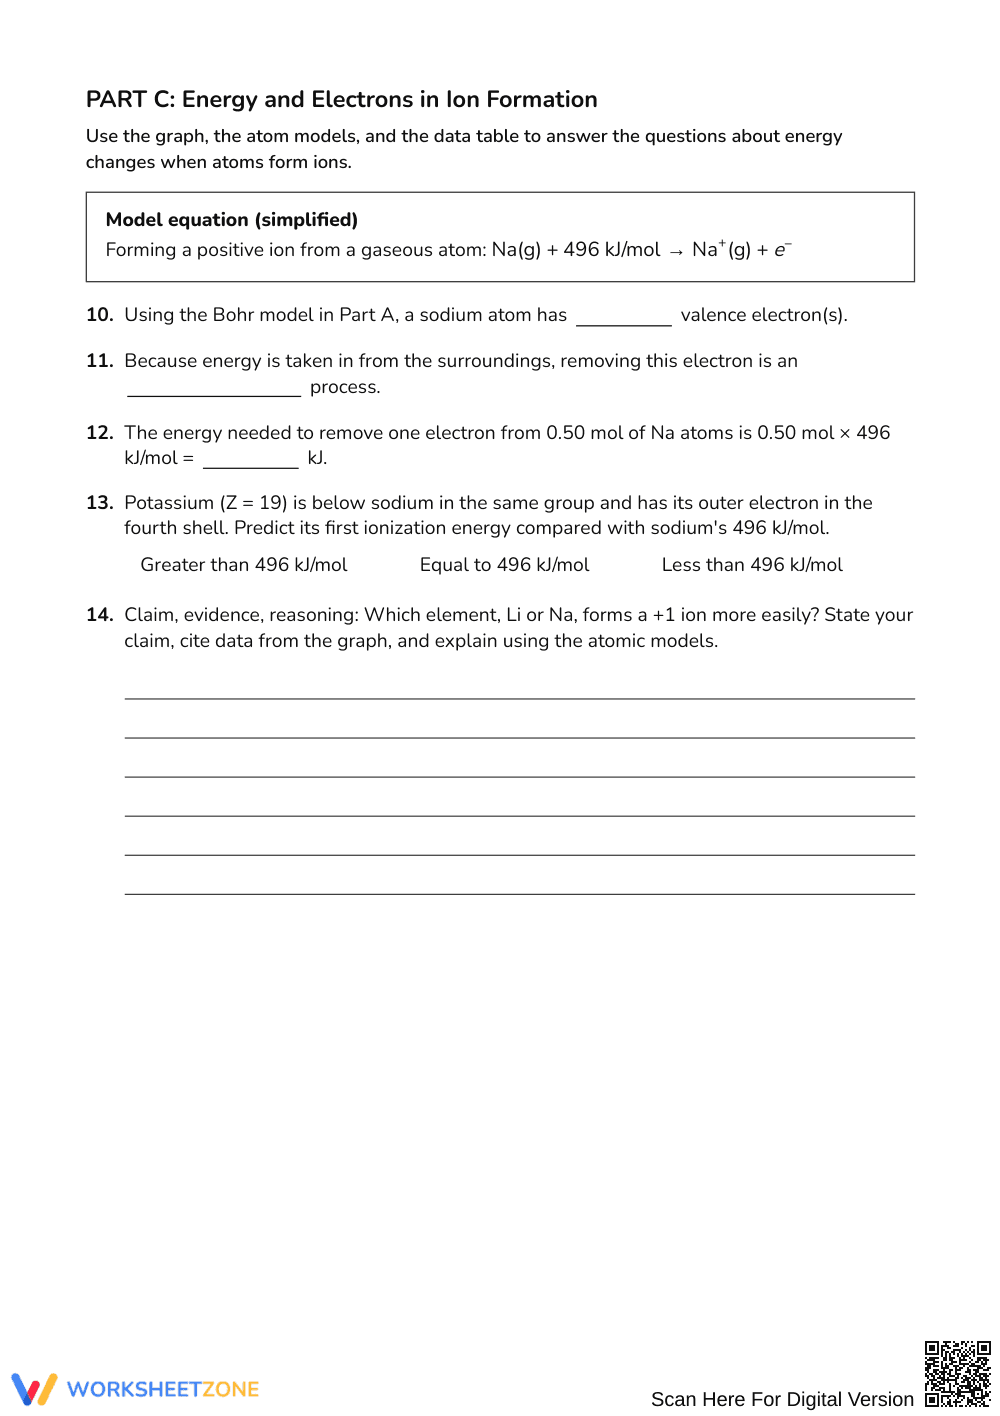
The four-page printable worksheet includes 19 structured questions spanning three progressive parts. Students examine a first ionization energy graph from lithium to sodium, interpret visual Bohr models, evaluate an unknown element property matrix, and compute reaction enthalpies. A full four-page answer key provides complete model answers and calculations.
Skill Progression
- Guided Practice (Part A, 7 tasks): Students read an ionization graph from Li to Na, identifying trends, subshell anomalies, and electron shielding mechanisms with low scaffolding.
- Supported Practice (Part B, 5 tasks): Learners evaluate an evidence table detailing conductivity, appearance, and reactivity to identify unknown samples with moderate scaffolding.
- Independent Practice (Part C, 7 tasks): Students compute endothermic ionization energies, predict group trends for potassium, and draft a claim-evidence-reasoning argument comparing Li and Na.
This structure employs the gradual release of responsibility model, transitioning students from guided visual decoding to independent scientific writing.
Standards Alignment
This activity aligns with high school physical science standards requiring students to use the periodic table as a model to predict relative properties of elements based on valence electron patterns. It supports scientific explanations grounded in empirical evidence. Both standard competencies can be copied directly into lesson plans, IEP goals, or district curriculum mapping tools.
How to Use It
Assign this worksheet during mid-unit practice on atomic structure, or immediately after showing the NOVA Hunting the Elements special. During class, observe whether students attribute sodium's low ionization energy to electron shielding rather than nuclear charge. The 19 problems take approximately 45 to 60 minutes for students to complete individually or in pairs.
Who It's For
This worksheet serves on-level and honors high school chemistry students mastering atomic structure and periodic behavior. For differentiation, provide struggling learners with colored highlighters to trace valence electrons on the Bohr diagrams before attempting Part C. Pair this resource with hands-on element sample kits or interactive periodic tables to connect macroscopic physical observations with atomic theory.
Developing secondary science literacy requires structured opportunities for students to synthesize graphical data, particulate models, and macroscopic observations into coherent explanations. According to Fisher & Frey (2014), the gradual release of responsibility framework accelerates scientific problem-solving when explicit instruction transitions deliberately from guided data interpretation to independent evidence-based argumentation. This four-page chemistry resource puts that pedagogy into practice across 19 targeted tasks. Students decode ionization energy trend graphs, examine nuclear shielding in Bohr models, and evaluate empirical property tables to deduce unknown elemental classifications. By engaging in quantitative endothermic energy calculations alongside structured claim-evidence-reasoning prompts, learners bridge abstract atomic theory with observable physical properties. Such integrated visual and quantitative tasks ensure high school students develop deep conceptual mastery of periodic trends, reinforcing the foundational analytical competencies necessary for advanced STEM coursework and standards-aligned science achievement.


