




























Views
Downloads




Complete Solubility Curves Worksheet | Grades 9–12 Science

Paste this activity's link or code into your existing LMS (Google Classroom, Canvas, Teams, Schoology, Moodle, etc.).
Students can open and work on the activity right away, with no student login required.
You'll still be able to track student progress and results from your teacher account.
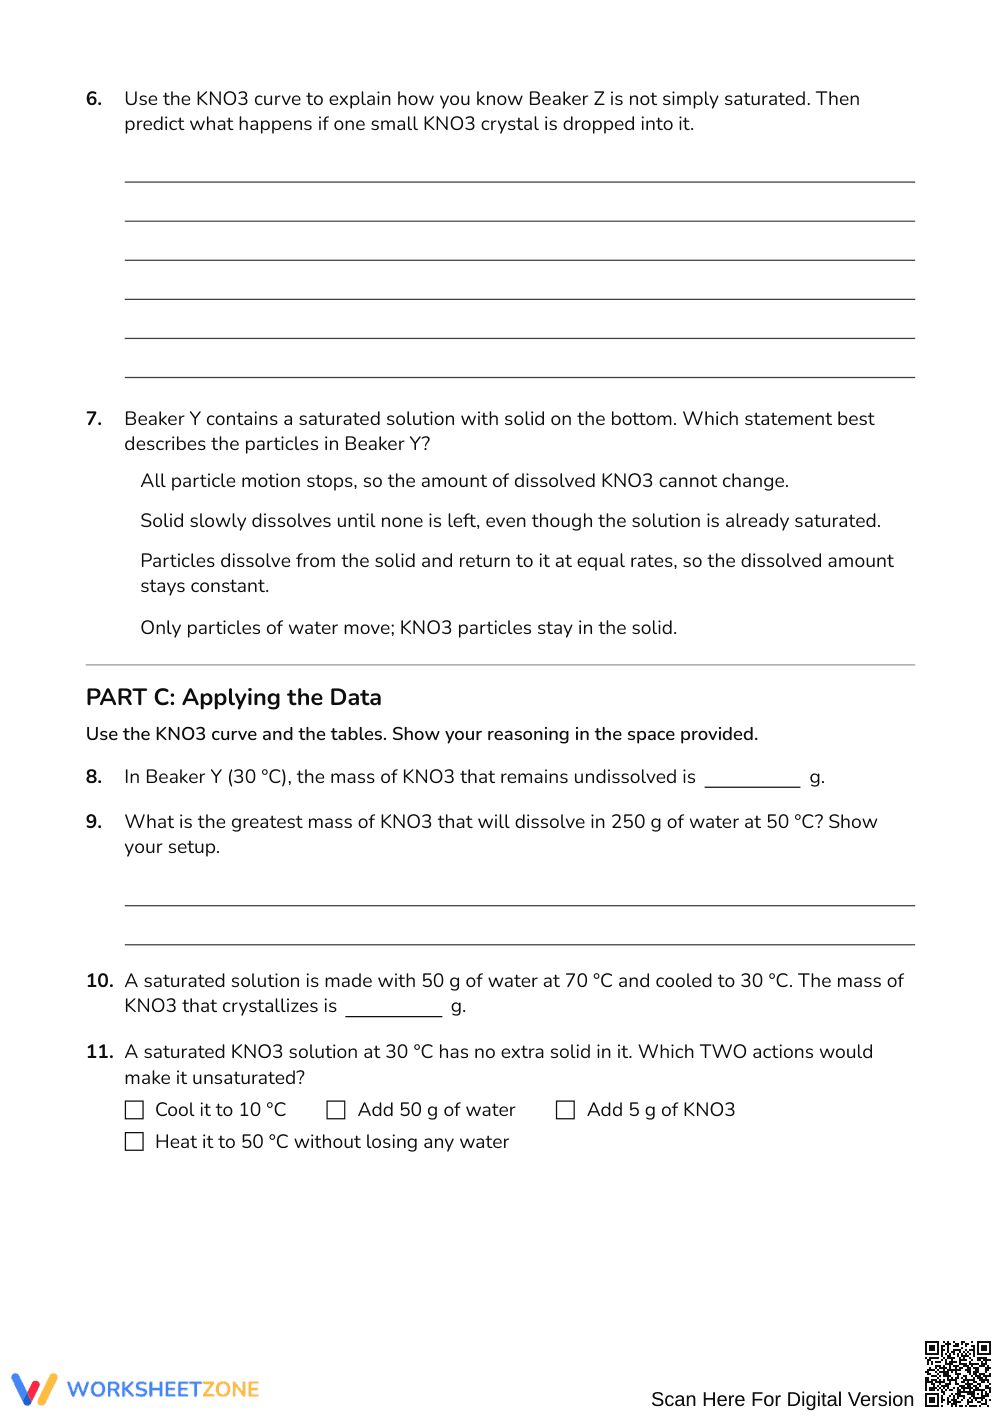
This comprehensive solubility curve worksheet equips high school chemistry and physical science students to interpret saturation curves, analyze particulate representations, and solve quantitative solution problems. Learners evaluate solid and gas solubility data, calculate crystallization yields, and connect macroscopic observations with endothermic dissolution thermodynamics.
At a Glance
- Grade: Grades 9–12 · Subject: Science
- Standard: High School Physical Science — Analyze solubility data, particulate models, and solution thermodynamics
- Skill Focus: Solubility curve data, saturation states, and crystallization calculations
- Format: 4 pages · 18 problems · Answer key included · PDF
- Best For: Cumulative chemistry assessment or review
- Time: 45–60 minutes
What's Inside
This 4-page assessment contains 18 structured problems arranged into four distinct scientific domains. Students examine graphical curves and reference tables for potassium nitrate, sodium chloride, and ammonia. The resource incorporates submicroscopic particle diagrams distinguishing unsaturated, saturated, and supersaturated beakers, multi-step mass-proportion calculations, and an aligned 4-page answer key detailing complete mathematical setups and particulate explanations.
Skill Progression
- Guided practice (Part A, 5 tasks): Students read solubility curves, identify temperature trends, contrast solid and gas solubility mechanisms, and calculate baseline crystallization yields.
- Supported practice (Parts B and C, 8 tasks): Learners interpret equilibrium models, distinguish saturation states, scale solvent volumes, and justify endothermic energy transfers.
- Independent practice (Part D, 5 tasks): Students evaluate claims about salt solubility and design a fractional crystallization procedure to isolate pure crystals.
This sequence reinforces gradual release, moving from graphical analysis to chemical reasoning and experimental design.
Standards Alignment
This resource aligns with high school physical science standards for solution equilibrium and energy changes. Students interpret phase behavior, evaluate particle equilibrium, and calculate mass ratios across changing temperatures. Both standard codes can be copied directly into lesson plans, IEP goals, or district curriculum mapping tools.
How to Use It
Deploy this worksheet after direct instruction on solution types and solubility curves as an end-of-unit cumulative exam or structured paired review. During class completion, monitor student work on Part B to identify misconceptions regarding dynamic equilibrium in saturated solutions, ensuring students recognize that precipitation and dissolution occur at identical rates. Expected completion time is 45 to 60 minutes.
Who It's For
This practice set serves general chemistry, honors chemistry, and physical science students mastering solution behavior. Teachers can differentiate by providing highlighters for multi-line curves or ratio templates for tiered learners. Pair this worksheet directly with a crystallization laboratory or an interactive solubility simulation.
Developing secondary science literacy requires students to bridge macroscopic laboratory phenomena, graphical data representations, and submicroscopic particulate models. As demonstrated by Fisher & Frey (2014), structured practice that guides students through gradual release builds durable quantitative reasoning and conceptual mastery in rigorous STEM coursework. This 18-problem, 4-page solubility curve worksheet targets key physical science competencies by requiring learners to extract values from data tables, calculate crystallization yields across scaled solvent masses, evaluate dynamic equilibrium in particle diagrams, and explain endothermic dissolution thermodynamics. By engaging directly with both solid and gaseous solutes across varying thermal conditions, students synthesize core principles of solution chemistry rather than relying on rote memorization. Designed for efficient instructional deployment, the complete resource and accompanying 4-page answer key support rigorous formative evaluation, standards-based grading, and targeted intervention across diverse high school science classrooms.


