




























Complete Biodiversity Data Worksheet | Grade 12 Science
Paste this activity's link or code into your existing LMS (Google Classroom, Canvas, Teams, Schoology, Moodle, etc.).
Students can open and work on the activity right away, with no student login required.
You'll still be able to track student progress and results from your teacher account.
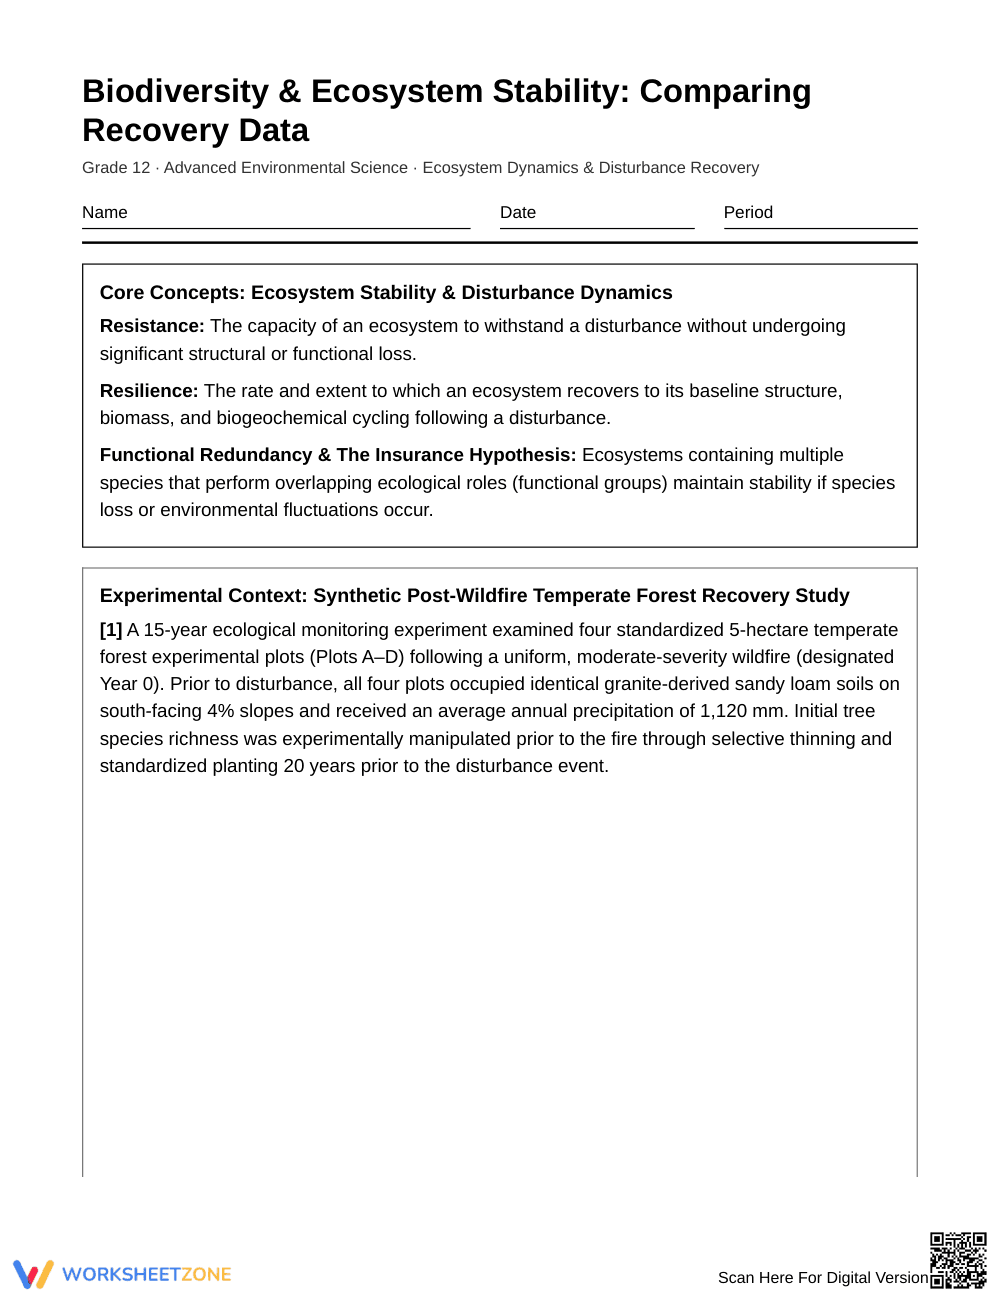
This Grade 12 environmental science worksheet equips students to evaluate the relationship between biodiversity, stand resistance, and post-disturbance resilience using multi-year recovery data. High school learners analyze standardized forest plots, calculate biomass recovery rates, and interpret biogeochemical indicators to explain functional redundancy and the insurance hypothesis.
At a Glance
- Grade: 12 · Subject: Environmental Science
- Standard: Advanced High School Science — Analyze quantitative ecological data to evaluate post-disturbance resilience and functional redundancy
- Skill Focus: Compare Biodiversity-and-Recovery Data
- Format: 5 pages · 10 problems · Detailed answer key included · PDF
- Best For: Advanced high school ecological data analysis practice
- Time: 45–60 minutes
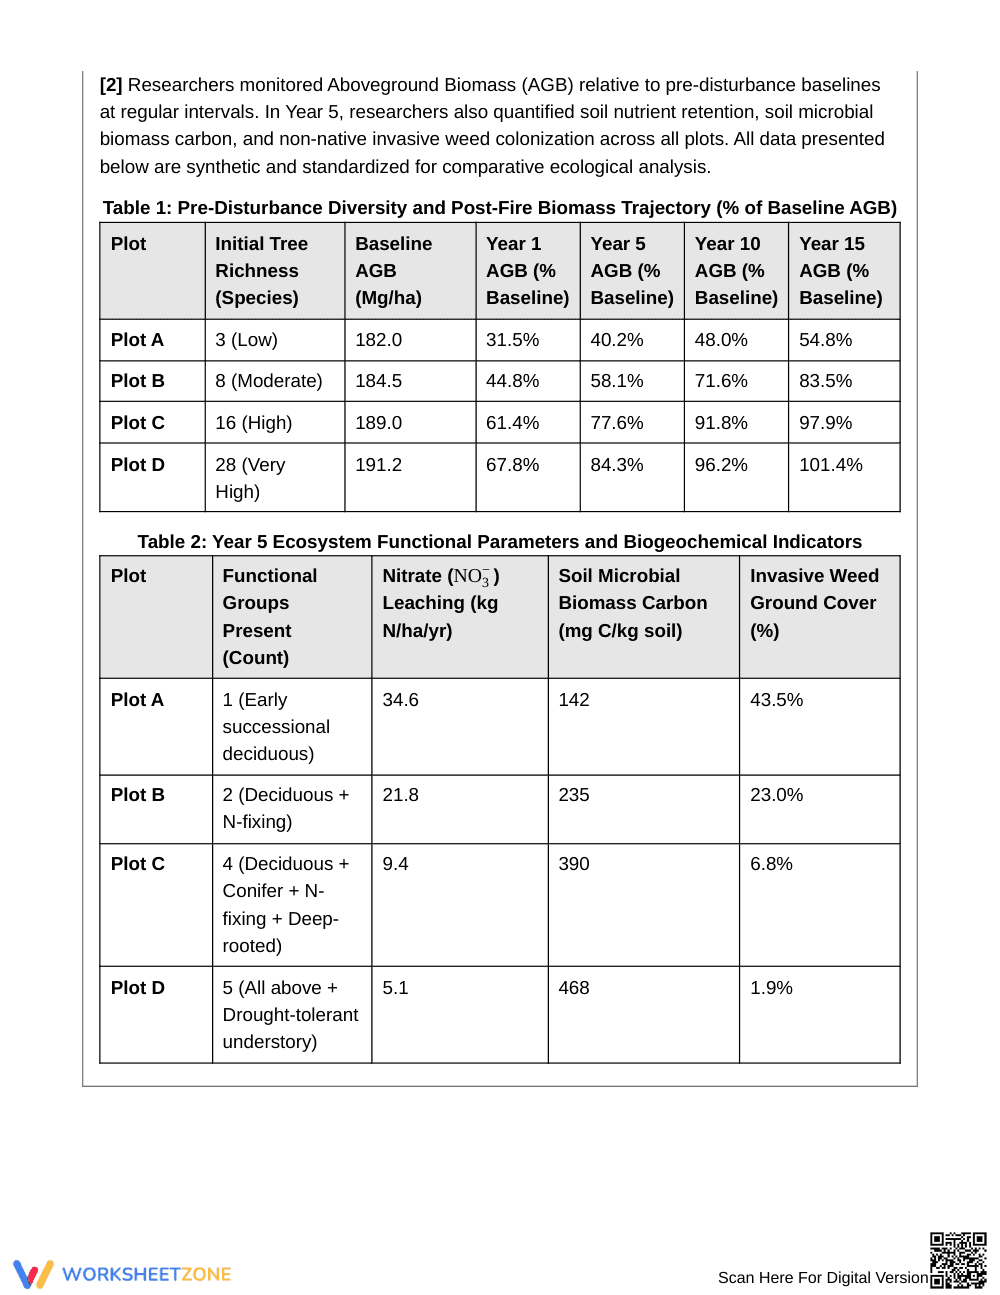
This 5-page printable resource includes 10 rigorous analytical problems structured around a 15-year post-wildfire recovery dataset across four experimental plots. Students analyze two multi-variable tables tracking aboveground biomass and Year 5 biogeochemical indicators, supported by a 3-page answer key detailing calculations and mechanistic explanations.
Skill Progression
- Guided practice (Items 1–2): Students extract baseline biomass values and nitrate leaching rates directly from tables to establish quantitative grounding.
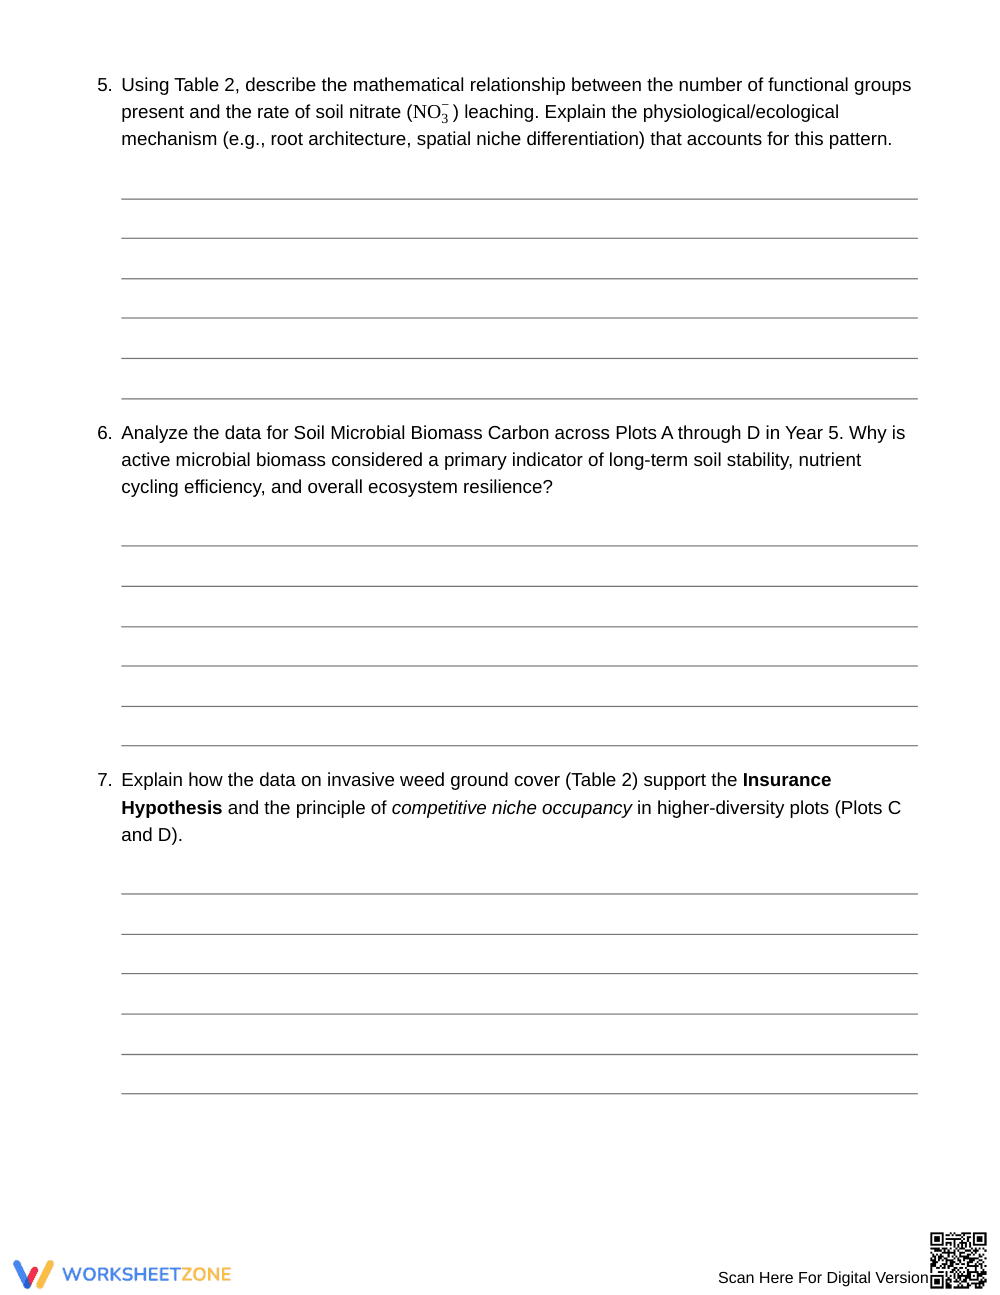
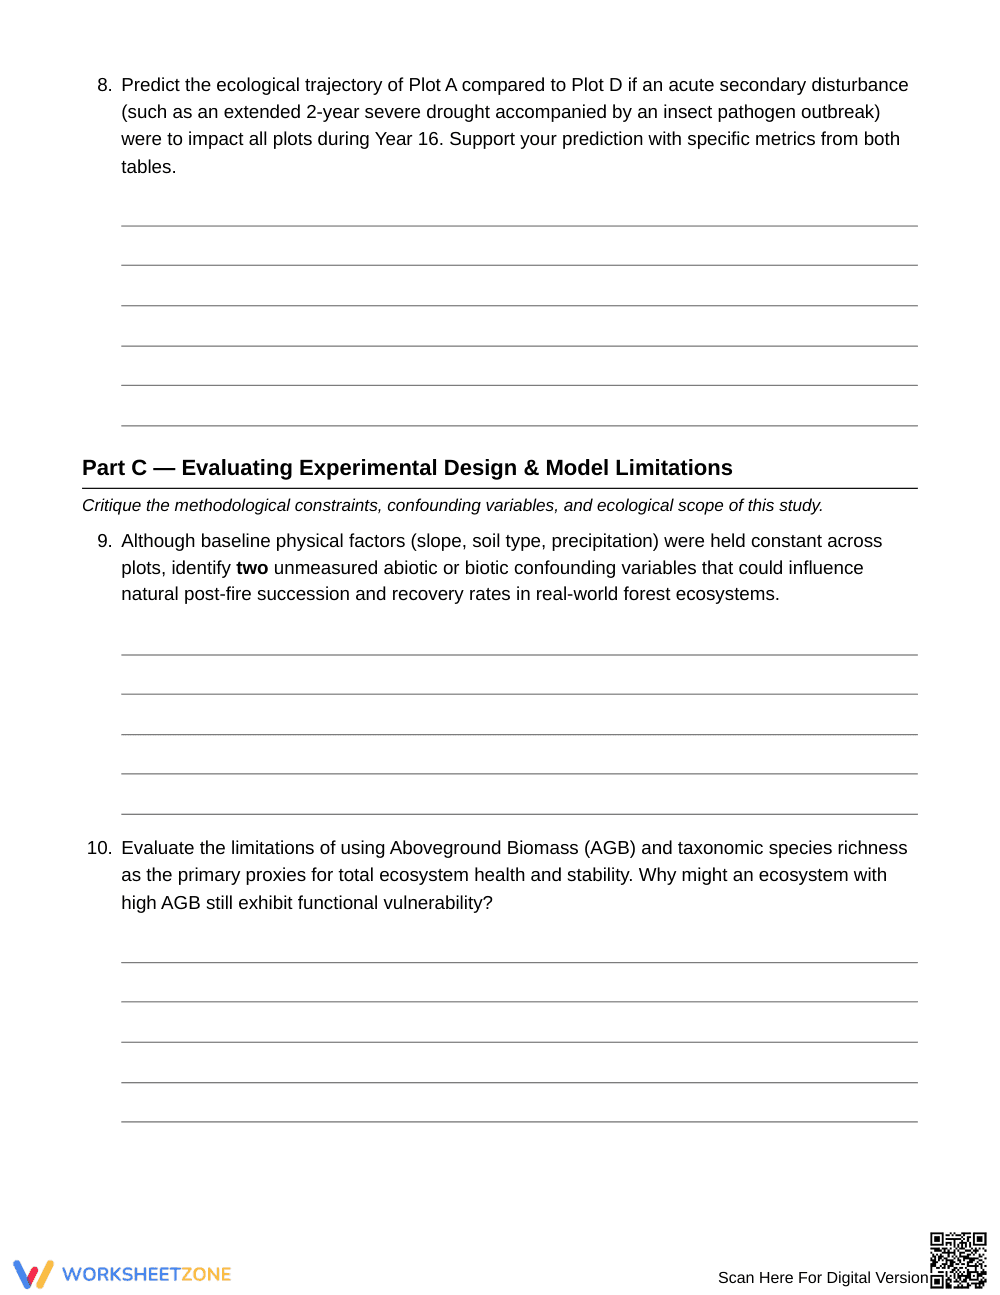
- Supported practice (Items 3–8): Learners calculate annual recovery rates, evaluate nitrate retention, analyze microbial biomass, and test the Insurance Hypothesis.
- Independent practice (Items 9–10): Students critique experimental constraints, identify confounding variables, and evaluate biomass limitations.
This sequence implements the gradual release model, guiding learners from data retrieval to high-level synthesis.
Standards Alignment
Designed for advanced secondary science, this resource aligns with standards requiring students to analyze data to evaluate ecosystem stability and resilience following disturbances. The tasks directly reinforce concepts of energy flow and functional redundancy. This standard alignment can be copied directly into lesson plans, IEP goals, or district curriculum mapping tools.
How to Use It
Deploy this worksheet after direct instruction on community succession and disturbance ecology. It works well for small-group collaborative analysis or independent practice. Formatively observe whether students correctly distinguish between initial stand resistance in Year 1 and long-term resilience over 15 years. Expected completion time is 45 to 60 minutes.
Who It's For
This resource serves Grade 12 AP Environmental Science, IB Environmental Systems, and honors biology students. It provides structured scaffolding via clear data tables while challenging students with mathematical rate calculations. It pairs naturally with direct instruction lessons on wildfire succession, biogeochemical cycles, or ecosystem stability case studies.
According to research on quantitative literacy in secondary science education (Fisher & Frey, 2014), structured data analysis tasks that require students to compare biodiversity metrics with ecosystem recovery trajectories significantly deepen conceptual understanding of ecological stability. By integrating multi-variable data tables, mathematical rate calculations, and mechanistic explanations of nutrient retention, this resource provides the systematic scaffolding necessary for twelfth-grade learners to master advanced environmental science concepts. Students move from basic value extraction to synthesizing the ecological mechanisms of functional redundancy, the Insurance Hypothesis, and disturbance resilience. Grounded in evidence-based pedagogical frameworks, the worksheet requires learners to evaluate experimental constraints and critique biomass proxies, ensuring rigorous alignment with scientific inquiry standards. Educators can utilize these 10 structured tasks to measure student mastery of ecosystem dynamics, quantitative data interpretation, and scientific argumentation across diverse instructional settings.


