Earthquake Worksheets for 8th Grade Science
These earthquake worksheets for 8th grade give teachers a targeted set of resources for one of the technically densest units in middle school earth science. The skills — reading seismograms, calculating S-P intervals, triangulating epicenter locations, classifying fault types — require students to link abstract wave physics to real data interpretation, and each worksheet takes one of those tasks as its central job rather than trying to cover the full unit at once.
Skills These Worksheets Build
The set covers the full arc of a standard seismology sequence. Students start with wave mechanics: labeling P-waves, S-waves, and surface waves on a diagram, then explaining the motion of each — longitudinal compression, transverse shear, and the rolling Rayleigh motion at the surface. One worksheet focuses specifically on why S-waves stop at the outer core boundary. Students need to understand this mechanically, not just memorize it: S-waves require a solid medium to transmit their shearing motion, and liquid rock doesn't provide the structural resistance needed to carry that kind of wave forward.
The data analysis worksheets move into S-P interval calculation. Students read a travel-time graph, measure the arrival time gap between P and S waves at a seismograph station, and convert that interval into a distance in kilometers. A separate triangulation worksheet then has students use a compass and regional map to draw three distance arcs and identify the intersection point as the epicenter.
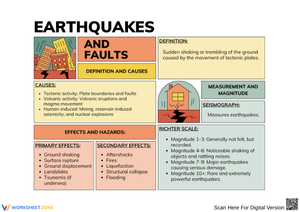
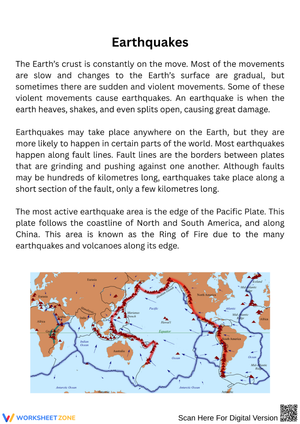
Additional worksheets address the measurement scales that give students the most trouble. Students compare the Moment Magnitude scale and the Modified Mercalli Intensity scale, sort seismic events on each, and explain in writing why a single earthquake produces one fixed magnitude value but different intensity values across different locations. The fault classification worksheet asks students to match cross-section diagrams to fault type — normal, reverse, or strike-slip — and identify the tectonic stress regime that produced each one. A mapping worksheet rounds out the set, with students plotting global earthquake locations and connecting the resulting pattern to the Ring of Fire and major plate boundaries.
Error Patterns Teachers Should Expect in This Unit
The magnitude-intensity confusion arrives reliably, and earthquake worksheets for 8th grade that present both measurement systems in the same activity help surface it quickly. The error takes a specific form in student writing: they describe a single earthquake as having different magnitudes at different locations — "the earthquake measured 5.5 in Los Angeles and 4.0 in San Diego" — treating both scales as if they produce location-dependent readings. That confusion is understandable; both numbers are associated with the same event, and without explicit contrast instruction, students lump them together.
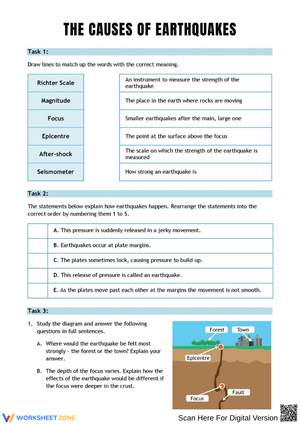
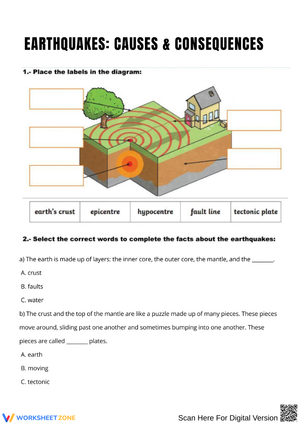
Epicenter versus focus confusion is equally predictable. Even after direct instruction, students frequently place the epicenter underground on a cross-section diagram — drawing it at the same location as the focus — because maps always show the epicenter but never the focus, so students who processed the distinction verbally haven't necessarily built the spatial model. A worksheet that shows both a map view and a cross-section view side by side, with students labeling each independently, clears this up more effectively than re-explaining the definitions.
The triangulation worksheet surfaces its own error category. Students who draw arcs instead of full circles often end up with three arcs that don't obviously converge, then either pick an arbitrary point or freeze entirely. Teaching students to accept a small triangular overlap region — and to place the epicenter at its center rather than expecting a perfect single-point intersection — is as important as the geometry itself. It opens a productive conversation about measurement error that applies broadly to scientific practice.
Working These Worksheets Into Your Lesson Sequence
The wave-type worksheet works well as a guided notes replacement on the first day of the seismology unit — dense enough to anchor a 20- to 25-minute discussion but focused enough not to overwhelm. The S-P interval and triangulation worksheets are better saved for a paired lab day where students have time to use compasses carefully; rushing the compass step is the direct cause of the arc error described above. Earthquake worksheets for 8th grade in this set also work as the anchor activity during Friday review blocks, where students need procedural practice more than new content — working through the triangulation steps again is more useful before a test than re-reading notes they've already processed.
The magnitude-intensity worksheet pairs well with a five-minute look at the USGS "Did You Feel It?" database before students start. Examining a real earthquake's intensity map — where the concentric zones of decreasing shaking extend outward from the epicenter — gives the abstract scale values a referent that makes the worksheet questions noticeably easier to answer.
Standard Alignment
These worksheets align most directly with NGSS MS-ESS3-2, which asks students to analyze and interpret data on natural hazards — including seismic events — to forecast catastrophic events and inform the development of technologies to reduce their effects. The triangulation and S-P interval activities address the crosscutting science and engineering practice of analyzing and interpreting data in that standard's specific context. Fault classification and plate boundary mapping support the disciplinary core ideas in ESS2.B (Plate Tectonics and Large-Scale System Interactions), reinforcing how internal Earth processes drive surface-level changes. Teachers in NGSS-aligned districts will find this set fits naturally at the close of a plate tectonics unit, just before moving into natural hazards and disaster preparedness.
Adjusting the Set for Different Readiness Levels
For students who struggle with the travel-time graph, providing one worked example — a completed row showing how a 35-second S-P interval maps to a specific distance in kilometers — gives them a reference point to work through the remaining stations without removing the mathematical reasoning from the task. The goal is to eliminate procedural confusion, not to reduce the underlying skill demand.
Students who move quickly through the triangulation activity benefit from a built-in extension: give them a fourth seismograph station and ask what should happen if all four circles are drawn correctly. The answer — all four converge on the same point, and any deviation reflects measurement error — generates a substantive conversation about precision and the reality that field data rarely produces clean theoretical results. Earthquake worksheets for 8th grade that include extension prompts like this one let teachers differentiate without preparing an entirely separate set of materials for each readiness tier.
Frequently Asked Questions
Why do three seismograph stations work for triangulation when two don't?
Two stations each define a circle of possible epicenter locations, and those circles intersect at exactly two points — leaving an unresolvable ambiguity. A third station's circle passes through only one of those two points, which identifies the epicenter. This is the same geometric principle that makes GPS positioning require signals from at least three satellites to fix a two-dimensional location, which gives students a useful modern analogy.
Do the worksheets use the Richter scale or the Moment Magnitude scale?
Both are addressed, with explicit explanation of why the Richter scale is now mainly a historical reference. The USGS and seismologists worldwide use the Moment Magnitude scale for current reporting, particularly for large events where the Richter scale consistently underestimates energy release. Students learn to distinguish which scale is being referenced and why comparing historical earthquake records to modern data requires understanding that difference.
What materials do students need for the triangulation worksheet?
A drawing compass and a sharp pencil. Each worksheet provides a printed map with seismograph station locations already marked; students supply the compass to draw circles at the correct radii. Teachers without class sets of compasses can substitute a piece of string cut to the correct length and a pencil held at the end — it's less precise, but the resulting imprecision creates a useful classroom moment about measurement error and why calibrated instruments matter in field science.
How long does each worksheet take in a standard class period?
The wave-type identification worksheet runs about 20 minutes for most 8th graders, with 5 to 10 additional minutes if you include whole-class discussion of the outer core S-wave question. The S-P interval and triangulation worksheets together fill a 45- to 50-minute period when compass work is factored in. The magnitude-intensity comparison worksheet is shorter — students who have a clear conceptual grip on the two scales finish in about 15 minutes, while students still working through the distinction often need the full period and a mid-activity check-in.
Clear All