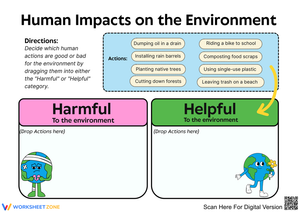
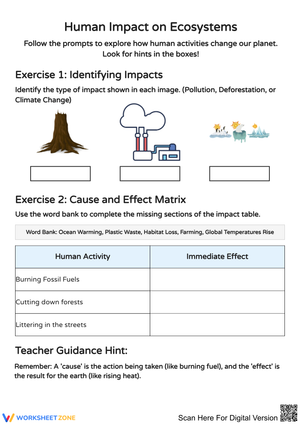
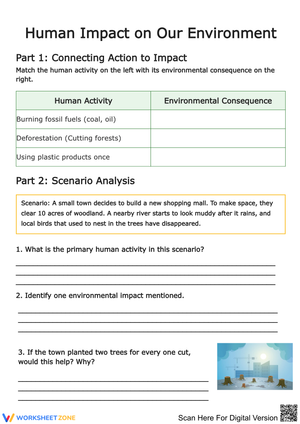
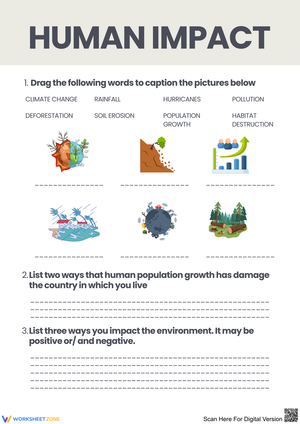
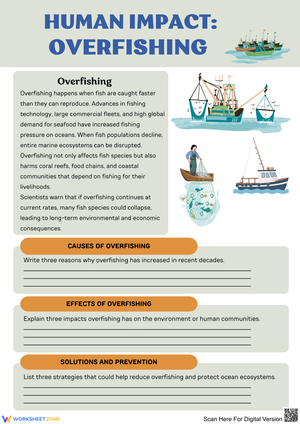
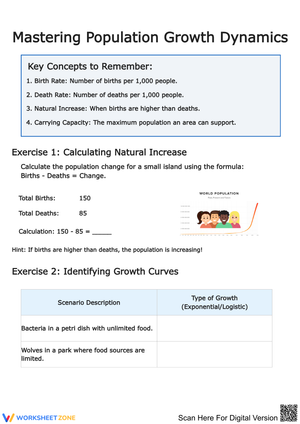
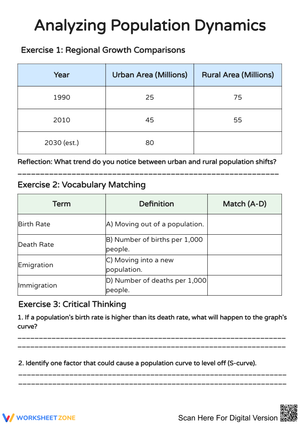
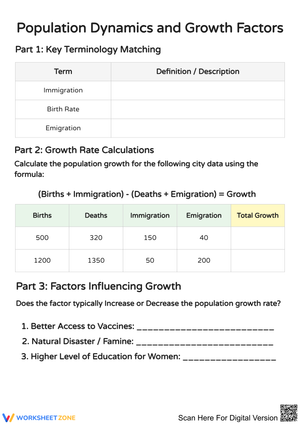
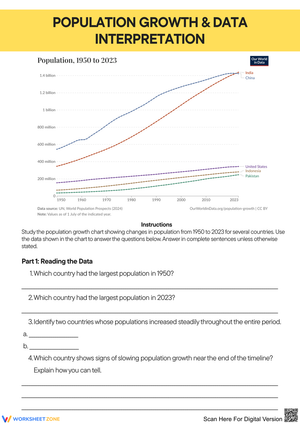
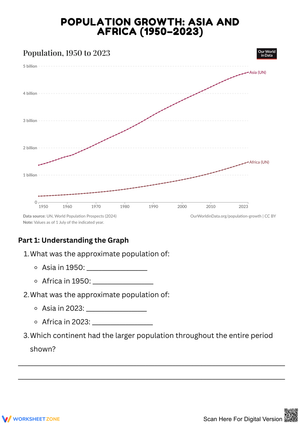
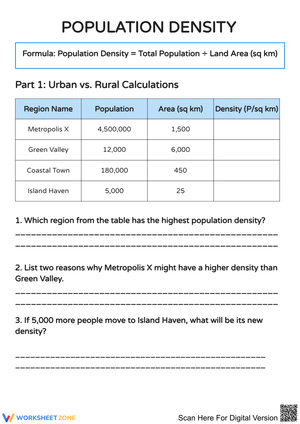
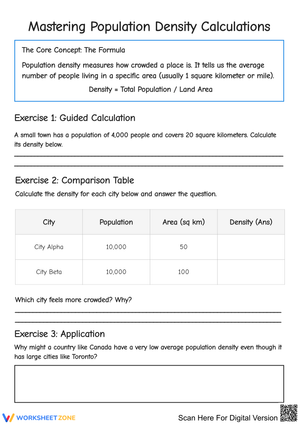
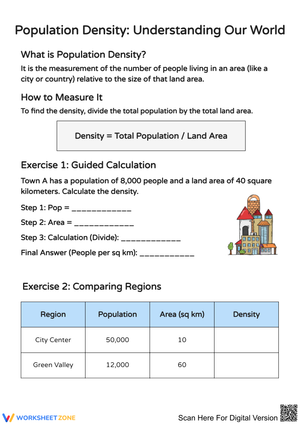
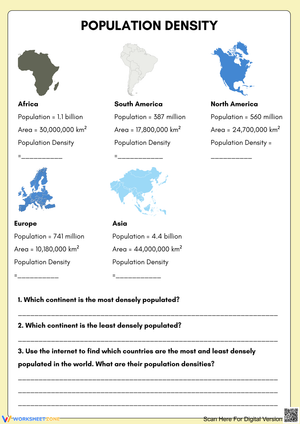
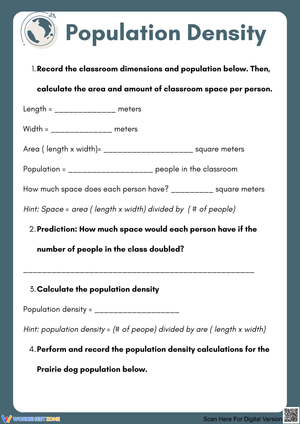
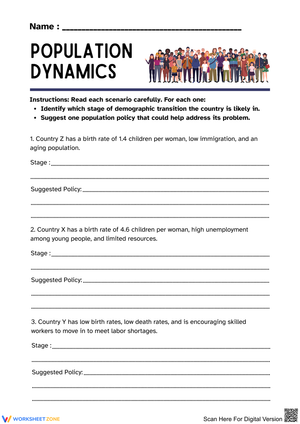
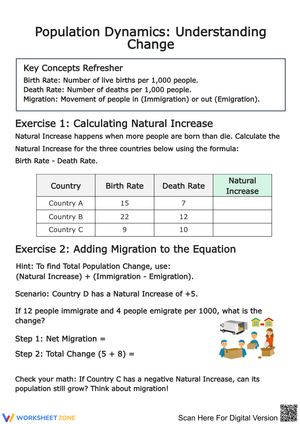
These 7th grade human impact worksheets give students a structured way to move past surface-level awareness — "pollution is bad," "deforestation is happening" — and into the kind of evidence-based analysis that NGSS actually demands. Each worksheet asks students to work with real data, trace cause-and-effect chains through Earth's systems, and defend conclusions in writing. That shift from awareness to analysis is where most Grade 7 environmental units stall, and it's what this set is built around.
The Specific Skills Targeted
The worksheets span the core content areas of MS-ESS3 — deforestation and carbon cycling, freshwater availability, marine pollution, energy trade-offs, and land use change — but the unifying skill across all of them is data interpretation tied to human causation. Students aren't just reading about the Great Pacific Garbage Patch; they're examining ocean current maps and plastic accumulation data to explain why convergence zones concentrate debris, then writing a claim-evidence-reasoning response about what that implies for marine food webs.
Other worksheets ask students to plot global temperature anomalies against CO₂ concentration data from the Keeling Curve and identify the inflection point where industrial activity becomes the dominant variable. A separate set covers land use change — students compare satellite imagery data showing forest cover loss between 1990 and 2020 in a given region, calculate percentage loss, and link those numbers to habitat fragmentation effects on species that require large contiguous territories. Throughout, students underline evidence in text passages, annotate graphs with written labels, and rewrite vague claims into precise scientific statements.
Standard Alignment
These worksheets align to NGSS MS-ESS3-3, which asks students to "apply scientific principles to design a method for monitoring and minimizing a human impact on the environment." That performance expectation sits at the intersection of Earth science content and engineering practice, which is why solution design tasks appear alongside data analysis throughout the set — the standard explicitly requires both. MS-ESS3-4 is also addressed in worksheets covering the relationship between resource extraction and global temperature trends, where students construct arguments from evidence about how human consumption patterns affect Earth's climate system. In classroom terms, these aren't standards you hit on a single test day; they're threaded through a full unit and these worksheets give you discrete, gradable moments to document student progress against each one.
Frequent Student Errors Worth Watching For
The most persistent error in this content area isn't factual — it's logical. Students conflate correlation with causation early and resist being corrected because the relationship feels obvious to them. A student who correctly identifies that urbanization has increased and local amphibian populations have declined will write "cities cause amphibian death" without accounting for which specific mechanisms (impervious surface runoff changing pH, light pollution disrupting breeding cycles, habitat fragmentation isolating populations) actually link the two. The worksheets address this by requiring students to name the mechanism, not just the trend.
A second error shows up in solution design tasks. When asked to propose a method for reducing a specific human impact, students frequently propose actions at the wrong scale — a student analyzing industrial water pollution will suggest "people should use less plastic," a response that's well-intentioned but doesn't engage with the actual system being studied. Watching for this mismatch between problem scale and proposed solution is worth a class discussion before students attempt those sections independently.
Building These Worksheets Into Your Lesson Plans
The most effective placement for these worksheets is the day after direct instruction on a system, when students have the vocabulary but haven't yet applied it to novel data. That 30–40 minute independent work block — not the intro day, not the end-of-unit review — is where the data interpretation tasks do their heaviest lifting. Several teachers have used the deforestation and carbon cycle worksheet as a Monday warm-up return after a weekend, treating it as spaced retrieval practice rather than new instruction.
For units structured around phenomena, these worksheets function well as the "what's the evidence?" anchor in a claim-evidence-reasoning sequence. Introduce the phenomenon (a local watershed showing elevated nitrogen levels, for instance), let students engage with the worksheet data, then bring the class back together for a whole-group discussion where they compare the mechanisms they identified. The worksheets also work as formative checkpoints mid-unit — not graded summatively, but scanned quickly to see which students are still writing correlation instead of causation before you move to the next system.
Adapting the Worksheets for a Range of Learners
For students who struggle with graph interpretation, the data worksheets include a scaffolded version that pre-labels axes and provides a sentence stem for the initial observation. Those students then write the inference and mechanism explanation on their own — the scaffold lowers the entry point without removing the analytical demand. This matters because the most common differentiation mistake in data-heavy science tasks is simplifying the thinking when what struggling students actually need is support with the reading of the visual.
For students working above grade level, the same worksheets extend naturally by removing the provided data range and asking students to identify what additional data they would need to strengthen their causal claim — essentially a peer-review task applied to their own reasoning. The marine pollution worksheet, in particular, has a natural extension in asking students to evaluate two proposed policy interventions using the data they've already analyzed and argue for one with evidence.
Frequently Asked Questions
Are these appropriate for 8th grade or advanced 6th grade students?
The data complexity and writing expectations are calibrated for Grade 7, but the deforestation and marine pollution worksheets have been used successfully as introductory material in 8th grade environmental science and as extension work in advanced 6th grade classes. The scaffolded versions make the 6th grade use more practical without reworking the core task.
Do these worksheets work in a digital classroom?
The PDFs are formatted for print, but the text-based response sections transfer cleanly into Google Forms or fillable PDF tools if you're assigning them digitally. Graph annotation tasks work best printed; the data interpretation questions and written responses work either way.












 Interactive Worksheet Maker
 Quiz Maker
 Word Search Maker
 Crossword Puzzle Maker
 Word Scramble Generator
 Sentence Scramble Generator
 Handwriting Worksheet Generator
 Name Tracing Generator
 Fill In The Blank Generator