


1 / 2
0
Views
0
Downloads

0.0
0
Save
0 Likes
Understanding Population Growth in Asia and Africa
0 Views
0 Downloads
Paste this activity's link or code into your existing LMS (Google Classroom, Canvas, Teams, Schoology, Moodle, etc.).
Students can open and work on the activity right away, with no student login required.
You'll still be able to track student progress and results from your teacher account.
Information
Description
What It Is:
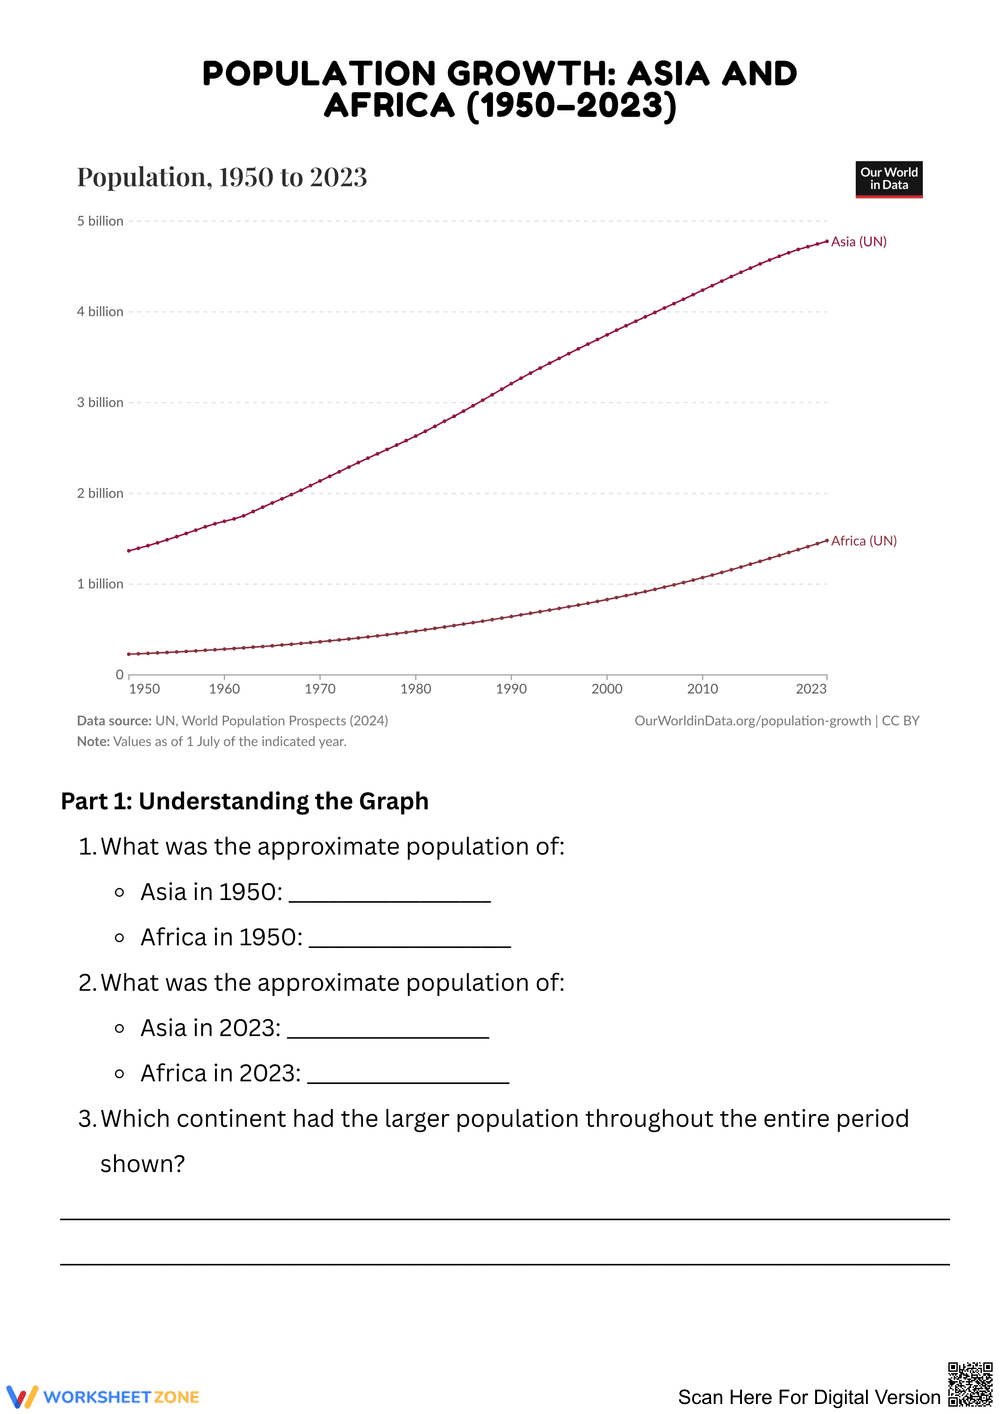
This worksheet explores population growth trends in Asia and Africa from 1950 to 2023 through a graph and related questions. It includes sections for understanding data and comparing trends between the two continents.
Why Use It:
This resource enhances comprehension of demographic changes and encourages critical thinking about population statistics and trends.
How to Use It:
• Analyze the graph provided.
• Answer questions about population figures.
• Compare growth trends of Asia and Africa based on the data.
Grade Suitability:
Best for Grade 6 to Grade 8.
• Younger kids focus area: basic data interpretation.
• Older students focus area: critical analysis of demographic trends.
Target Users:
This worksheet is ideal for teachers and students studying geography and social sciences.