7th Grade Percent Error PDF Worksheets
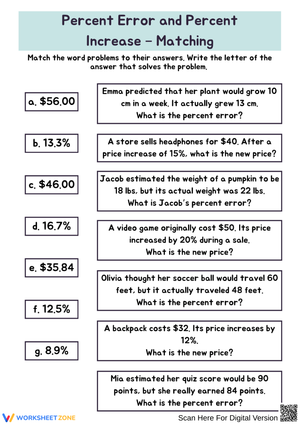
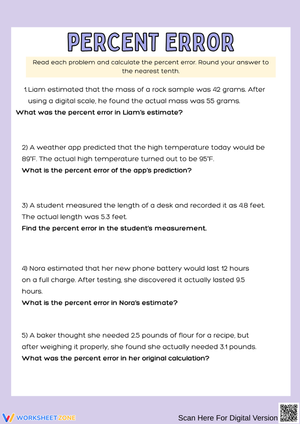
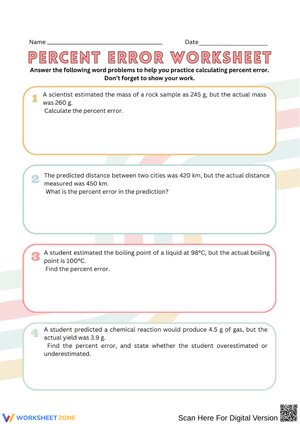
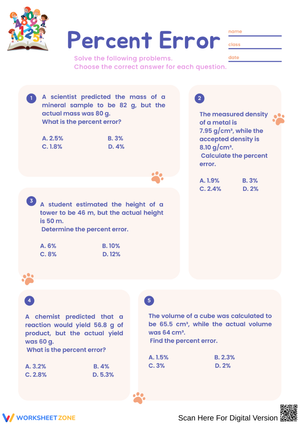
These 7th grade percent error pdf worksheets give teachers a set of standalone practice resources targeting the concept Grade 7 students most consistently set up incorrectly: calculating how far an estimate or measurement falls from a known actual or theoretical value. Each worksheet works independently — some focus on the formula steps in isolation, others embed the calculation inside science-lab and everyday measurement contexts. The result is a collection teachers can draw from across a full instructional unit rather than burning through everything in a single class period.
The Calculation Steps Each Worksheet Isolates
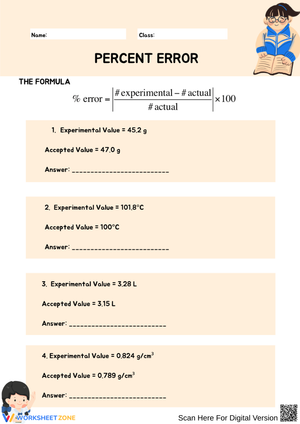
The standard percent error formula — absolute value of the difference between estimated and actual, divided by the actual value, multiplied by 100 — looks manageable until students try to apply it inside a paragraph-length word problem. Each worksheet in this set presents the formula as a labeled sequence: identify the estimated value, identify the actual value, find the signed difference, apply the absolute value, divide by the actual, convert to a percentage. That step-by-step format is not about making the math easier — it makes each student's thinking visible so teachers can pinpoint exactly where a calculation breaks down.
The 7th grade percent error pdf worksheets in this collection cover five problem formats:
- Direct formula practice using whole numbers and clean decimals, where both values are stated plainly in the problem
- Science-context word problems — pendulum timing, temperature recordings, density measurements — that mirror what students encounter in lab write-ups
- Manufacturing and measurement scenarios asking whether a part or ingredient falls within an acceptable tolerance
- Error analysis problems presenting finished, intentionally incorrect work for students to locate and fix
- Multi-step problems where students must first derive one of the values before the percent error formula can be applied
Mistakes Students Make That These Worksheets Help You Catch
The most consistent mistake in student work is placing the estimated value in the denominator instead of the actual value. It happens in a predictable way: students set up the numerator correctly by subtracting, then divide by whichever number they wrote down first — and that is often the estimate. A problem like "Keisha predicted 80 students would attend the assembly, but 95 actually came" trips up a substantial portion of a class because 80 appears first in the sentence and becomes the default denominator. A reliable fix: before any computation, have students underline and label the actual value directly on the worksheet. That physical mark becomes a checkpoint before they write anything below the fraction bar.
Two other patterns appear regularly. Students who recently completed percent change problems sometimes skip the absolute value step entirely and record a negative percent error — they carry over the convention from percent decrease without realizing the formulas serve different purposes. Separately, many students calculate the percentage correctly but cannot then interpret it: they know they got 14%, but when the problem asks whether the estimate was accurate, they guess or confuse "larger percent error" with "larger estimate." Both patterns are worth addressing during class discussion, not just through written feedback on a finished worksheet.
How to Build These Worksheets Into Your Lesson Sequence
A workable three-stage structure starts with direct instruction, moves to guided practice, and closes with independent work before looping back with the error analysis material. During direct instruction, model one problem aloud and narrate the decision of identifying which value is actual and which is estimated before writing any formula. That decision point is where most errors originate — naming it explicitly during modeling gives students language to use when they check their own setup later. The error analysis worksheet fits naturally after students have completed one round of independent practice: once they have solved problems themselves, they are in a better position to spot where a fictional student went wrong.
These 7th grade percent error pdf worksheets also integrate well into a cross-curricular block with science. After students run a simple lab — timing a pendulum swing, recording a temperature change, measuring a density — have them use a science-context worksheet to calculate percent error with their actual collected data. The shift from abstract word problems to numbers students generated themselves changes how they engage with the formula. A student who gets 3% error on their own lab data and a classmate who gets 28% on the same experiment have a genuine conversation to have about what those numbers mean.
Standard Alignment
These worksheets address CCSS 7.RP.A.3, which asks Grade 7 students to solve multi-step ratio and percent problems in real-world and mathematical contexts. Percent error occupies a specific place within that standard: it combines ratio setup, decimal computation, and contextual interpretation in a single problem type. Teachers who cover percent error purely as arithmetic — without pressing students to explain what the resulting percentage means — address only part of what the standard targets. Interpretation prompts appear throughout the set for this reason: questions like "Was this estimate accurate? Justify your answer" push students past calculation and into the reasoning the standard actually requires.
Adjusting the Set for a Mixed-Ability Class
The variation across problem types in these 7th grade percent error pdf worksheets makes differentiating a lesson practical without requiring entirely separate materials for every tier. Students who are still working on decimal division start with the whole-number problem sets, where the arithmetic is simple enough that they can keep their full attention on formula structure — specifically, on which number belongs in the denominator. Once they can make that choice reliably, they move to decimal problems, then to science-context word problems that demand closer reading to extract the relevant values from longer descriptions.
For students who move through the formula quickly, the multi-step and error analysis worksheets provide real challenge. Multi-step problems require deriving one of the values from given information before the formula can even be applied — a genuine extension rather than more of the same type of question. The error analysis format also works effectively at all levels during partner work: a student who recently mastered the formula tends to articulate the logic more clearly to a classmate than a teacher does, simply because the reasoning is still newly formed.
Frequently Asked Questions
What is the difference between percent error and percent change?
Percent change measures how a value shifted relative to a starting point — the result can be positive or negative depending on direction. Percent error measures the accuracy of an estimate or measurement against a known exact or theoretical value. Because percent error is about the magnitude of a discrepancy rather than its direction, the formula uses absolute value in the numerator, and the result is always a non-negative number. The two formulas look similar at a glance, which is exactly why students conflate them after working with percent change — addressing the distinction explicitly during instruction prevents it from becoming a persistent confusion.
Can percent error be greater than 100%?
Yes. If a student estimates that a container holds 20 liters when the actual volume is 8 liters, the error is 12 — divided by the actual value of 8, that gives 1.5, or 150%. A result greater than 100% simply means the estimate was off by more than the actual value itself. This surprises students who assume percentages always cap at 100, and it is worth running through one concrete example before they encounter it cold in a problem.
How do students determine which value is the actual value in a word problem?
Look for language like "actual," "exact," "true," "theoretical," or "measured precisely by an expert." The estimated value typically pairs with words like "predicted," "guessed," "thought," or "the student measured." Teaching students to annotate the word problem before writing any formula — identifying and labeling each value on the page — is more reliable than asking them to hold that distinction in working memory while also performing arithmetic.
Why does it matter which value goes in the denominator?
Swapping the values in the denominator produces a different percentage, and the difference can be large enough to change the interpretation of the result. With an actual value of 40 and an estimate of 60, the correct percent error is 50%. Dividing by 60 instead gives approximately 33% — a meaningfully different answer. The denominator determines the scale against which the error is measured, and the actual value is always the correct reference point for that comparison.
Clear All