These measures of variation pdf worksheets for 7th grade give students structured practice moving past single-number summaries and into describing spread — calculating range, locating quartiles, finding interquartile range, and using those measures alongside centers to compare two distributions. Each worksheet targets a specific step in that progression, from ordering raw data and identifying extremes to written comparison tasks built around dot plots and box plots.
What Students Practice Across the Set
Range comes first because students can reach it immediately once they order a list. Quartiles require more care — students identify the median, then find the median of each half. Interquartile range follows as a subtraction step, but the real work is understanding why IQR describes a dataset more reliably than range when extreme values are present. Each worksheet builds one step before asking students to combine them.
- Ordering data sets from least to greatest as the foundation for every calculation that follows
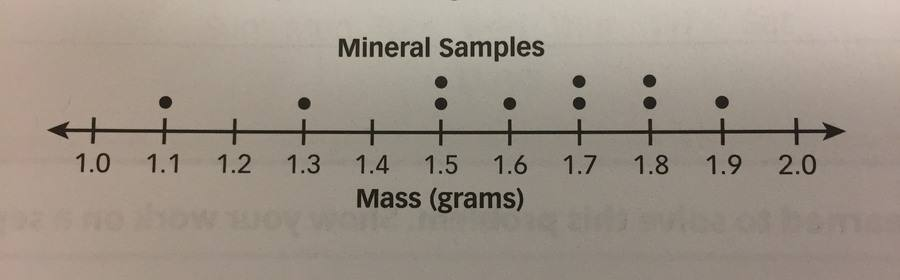
- Finding minimum, maximum, and range from both lists and visual displays
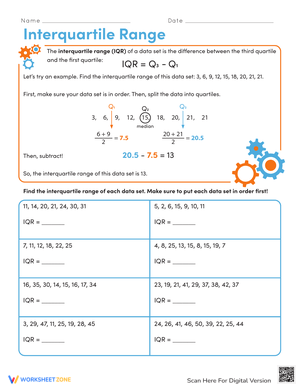
- Locating Q1 and Q3 and calculating IQR from ordered data
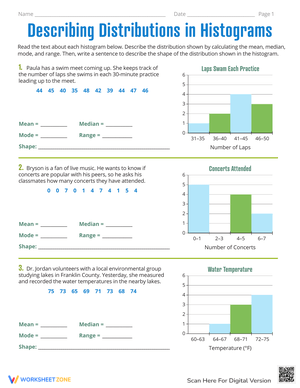
- Reading and interpreting box plots by matching the five-number summary to the visual
- Comparing two distributions using both a center measure and a spread measure together
- Writing brief justifications that explain what a difference in spread actually means in context
The justification prompts matter because calculation alone doesn't show whether a student understands variability. A student who writes "the IQR is 12" has shown arithmetic. A student who writes "the middle half of Group A spans 12 points, nearly double Group B's, so Group A's scores are less consistent" has shown statistical thinking. Both responses tell you something different about what that student is ready to do next.
Errors Teachers Should Anticipate and Catch Early
The most persistent mistake with interquartile range is a quartile-placement error that appears in datasets with an odd number of values. When a dataset has 9 values, students correctly identify the median — the 5th value — and then include that same value in both halves before locating Q1 and Q3. That shifts both quartiles and produces a wrong IQR. If teachers check only the final answer, the error stays invisible. The answer keys in this set show the ordered list and marked quartile positions, so the process mistake is easy to pinpoint.
Box plot work introduces a second problem. Many 7th graders read the visual length of the box as a rough estimate of spread rather than a precise representation of IQR. They'll describe a dataset as "pretty spread out" because the box looks wide on the page, without connecting that width to an actual numerical difference between Q1 and Q3. Asking students to write the IQR below the box plot before answering any comparison question closes that gap quickly.
Measures of variation pdf worksheets for 7th grade that include side-by-side examples — one clean dataset alongside one with a clear outlier — are the most effective way to address the range-versus-IQR confusion. Many students default to range even after they understand that IQR excludes extremes, simply because range is the first measure they practiced. A concrete comparison gives them a real reason to choose deliberately rather than out of habit.
Fitting These Worksheets Into Your Instructional Week
Most Grade 7 teachers spend one session on range, then two or three more on quartiles and IQR before shifting to comparison tasks. These worksheets match that pace. The early worksheets in the set work well as guided practice during direct instruction — students work a problem, the class checks it together, then students try the next one. The later worksheets hold up as independent work or homework once the procedure is stable.
- Morning warm-up: a five-value list takes about four minutes to order, find range, and call out — a clean reactivation routine before introducing IQR
- Partner stations: two students, two worksheets showing different distributions, one discussion prompt asking which dataset is more variable and why
- Intervention groups: pull students who need support and work through a worksheet with pre-ordered values, removing the ordering step so attention stays on quartile placement
- Friday review: one mixed worksheet combining range, IQR, and a box plot item gives a fast read on where students are before the weekend break
The written justification prompts are worth treating as a brief discussion, not just a completion task. After students write their sentences, asking two or three pairs to share creates a language routine around terms like more consistent, greater spread, and similar center but different variability — language students need when they move toward formal inference work later in the unit.
Standard Alignment
CCSS 7.SP.B.4 — Use measures of center and measures of variability for numerical data from random samples to draw informal comparative inferences about two populations. In classroom terms, this standard means students are not finished when they calculate IQR; they have to use that number to make a claim about a distribution. This set is built around that sequence — compute, then interpret, then compare — which is where 7.SP.B.4 typically lands on a curriculum map: three to four weeks into a statistics unit, after students have already worked through measures of center.
Adjusting the Set for Different Learner Readiness Levels
Students who struggle with the procedure need two things above all: smaller datasets and pre-ordered values. Starting with seven or eight numbers instead of twelve reduces the cognitive load of the ordering step and keeps attention on quartile placement. The early worksheets in the set work for this without modification — assign them to students who need more time while others move to comparison tasks.
For students who have the calculation down and need more challenge, the most effective move is changing the representation rather than simply increasing the number count. Give them two box plots with nearly identical ranges but clearly different IQRs, then ask which dataset is more consistent and why. That question has a right answer, but reaching it requires thinking carefully about what each part of the box represents — not just where to subtract.
One honest limitation worth naming: the written justification prompts frustrate students who are strong at computation but have had little practice explaining reasoning in math class. That's an argument for modeling a sentence stem aloud before students write — something like the spread is greater because... or Group A is more consistent because its IQR shows that... — not an argument for skipping those items.
Frequently Asked Questions
Which measures of variation do 7th graders need to know?
At this grade level, range and interquartile range are the two central measures. Both appear in CCSS 7.SP.B.4 and on most state assessments that test seventh-grade statistics. The measures of variation pdf worksheets for 7th grade in this set focus on those two measures because they are what students use when drawing informal comparative inferences about two populations — which is the core expectation at this level.
How do students correctly find IQR from a raw data list?
Order the values from least to greatest. Find the median of the full dataset — that value is not included in either half. Find the median of the lower half (Q1) and the median of the upper half (Q3). Subtract Q1 from Q3. The answer keys in this set show the ordered list and the marked quartile positions, so teachers can identify exactly where a student's process broke down rather than simply marking the final answer wrong.
How should I sequence these worksheets within a statistics unit?
Start with the range worksheets — they bridge well from measures of center work most students completed earlier. Move to quartile identification, then IQR calculation, then box plot interpretation. Save the two-distribution comparison worksheets for after students have the procedural steps stable. That sequence follows the 7.SP.B progression and keeps the conceptual load manageable at each stage.
Can these worksheets hold up for test-prep review?
The comparison items — where students evaluate two distributions using both center and spread — mirror the format that appears on most state assessments at this level. The written justification prompts prepare students for constructed-response questions that ask them to explain reasoning rather than report a number. Measures of variation pdf worksheets for 7th grade with that combination of item types carry more review value than computation-only practice.