Wavelength Worksheets for 6th Grade: Classroom Practice Ideas
Wavelength worksheets for 6th grade give students something that classroom notes alone rarely do: a chance to slow down with a diagram, find a crest, find the next matching crest, and commit that distance to paper before moving on. Each worksheet in this set focuses on one or two tasks at a time — identification, measurement, comparison, or written explanation — so the concept has room to settle instead of being buried under a long list of directions.
Mistakes Students Make That These Worksheets Surface Immediately
Two errors show up in almost every class during a waves unit. The most common: students measure from crest to trough, stopping at the halfway mark instead of continuing to the next matching point. On paper, this looks like a neat bracket that spans the wave — but it captures half a wavelength, not one full cycle. The second error is subtler. Students who have just finished labeling a crest and a trough will frequently mark the vertical distance as "wavelength" because they just measured something on the diagram and wavelength is the next prompt. The two concepts are introduced close together, and without a clear visual separation, students blend them.
There is also a persistent intuition problem: many students assume a taller wave must be longer. Show two waves in equal horizontal space — one with high amplitude and short wavelength, the other with low amplitude and long wavelength — and a number of students will still identify the taller wave as having the longer wavelength. Each worksheet in this set includes at least one side-by-side comparison that directly confronts that assumption, because it is the kind of error that does not self-correct through more exposure to the same diagrams.
A quick technique worth sharing: before students write any measurement, ask them to draw a light pencil bracket over one full cycle — starting point to next identical point. That physical step separates the horizontal question of wavelength from the vertical question of amplitude and reduces the crest-to-trough error noticeably in practice.
What's Inside the Set
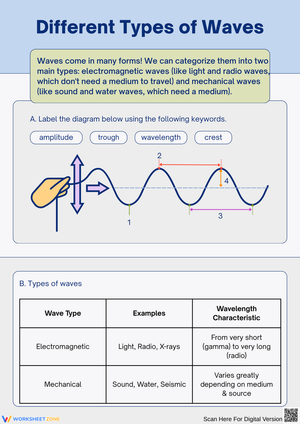
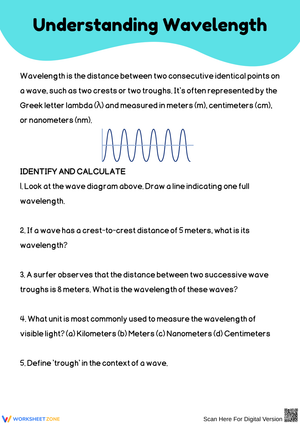
These wavelength worksheets for 6th grade build from recognition toward explanation. The first worksheets in the sequence ask students to mark and label wave parts on a clean transverse wave diagram: crest, trough, amplitude, and wavelength. From there, the worksheets shift to measurement — students count grid units between matching points and record a value with units. Later in the set, students compare two or three waves drawn in the same horizontal space and write a sentence explaining which wave has the higher frequency. The final worksheets connect wavelength to real-world wave types: sound moving through different media and the visible portion of the electromagnetic spectrum, both handled descriptively rather than through calculation.
- Part identification: Students mark and label crest, trough, amplitude, and wavelength on provided diagrams.
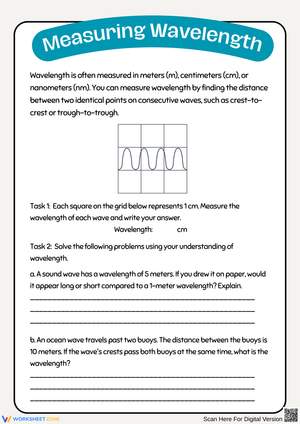
- Measurement from grids: Students count grid units or use a ruler to find the distance between matching points and record a value with units.
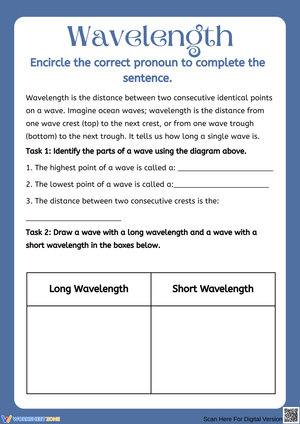
- Wave comparison: Students examine two or three waves drawn in equal horizontal space and rank them by wavelength and frequency.
- Written explanation: Students explain in their own words why a wave with more cycles in the same space has a shorter wavelength.
- Cross-context application: Students connect wavelength to sound and to visible light at a descriptive, Grade 6-appropriate level.
The writing tasks matter more than they might appear. Many sixth graders read wave diagrams accurately by mid-unit but still write "the length of the wave" when asked to define wavelength in a sentence. Pushing students to write a precise definition — "the distance from one crest to the next identical crest" — reveals gaps that diagram work alone cannot.
How to Work These Worksheets Into Your Lesson Plans
On the day wavelength is first introduced, the labeling worksheet works well as a guided class activity. Project a large version, model where to place the start and stop points of one full cycle, and have students mark their own copy in parallel. Move to the measurement worksheet the next day as a partner activity during the first ten minutes of class — two students, one ruler, one set of diagrams. Students who finish early can be asked to write their explanation in a full sentence rather than just circle an answer.
For the last few minutes before the bell, a wave comparison question from any worksheet makes a clean exit ticket: sketch a long-wavelength wave and a short-wavelength wave in the same box, label both, and identify which has the higher frequency. What comes back tells you immediately who is ready to move on and who still has the crest-to-trough confusion.
Wavelength worksheets for 6th grade also fold well into a station rotation. A cut-and-measure strip activity at one station alongside a diagram-comparison worksheet at another gives students two different interaction formats for the same concept in a single class period. The repetition sticks because the format changes.
Standard Alignment
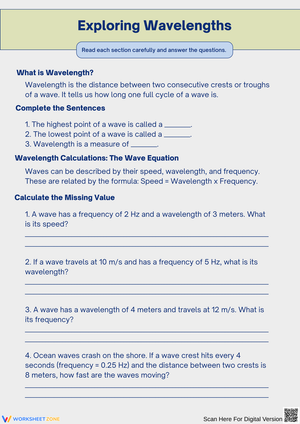
These worksheets address NGSS MS-PS4-1 and the disciplinary core idea PS4.A: Wave Properties, which asks students to use representations — diagrams, models, and simple measurements — to describe how waves behave. In classroom terms, that means reading a wave model, extracting information from it, and explaining the relationship between wavelength and frequency. The standard does not require algebraic manipulation at this level, which is exactly why these worksheets keep tasks visual and descriptive. Students meet the intent of the performance expectation through diagram reading and written reasoning rather than through formula application.
Differentiating These Worksheets Across the Class
Wavelength worksheets for 6th grade are usable across a wider ability range than most wave resources because the visual format gives every student a clear starting point. Students who are still building science vocabulary can complete the labeling and identification tasks successfully. Written explanation tasks may need light support for some students — a sentence frame such as "The wave with ______ cycles has a ______ wavelength because ______" maintains the conceptual demand without blocking access for students still acquiring academic language.
For students who move through identification and measurement quickly, the comparison tasks become more challenging with a generative constraint: draw a wave with the same amplitude as Wave A but half its wavelength. That prompt requires students to construct a wave rather than read one, which reveals whether they genuinely understand the concept or are pattern-matching from a diagram. No extra materials needed — a blank space at the bottom of an existing worksheet and a verbal prompt from the teacher is enough.
Frequently Asked Questions
How many cycles should appear on a diagram for sixth graders to measure accurately?
Two to three full cycles is the practical range. With only one cycle, students lose the visual pattern that confirms they have found a complete wave. With more than four or five cycles crowded into a small diagram, lines sit too close together and measurement errors increase. The diagrams in this set show two to three cycles with clear grid backing so students can count spaces rather than estimate.
Should students measure in centimeters or in grid units?
Both appear across the set, for a specific reason. Grid-unit measurement builds the conceptual idea that wavelength is a distance without tying it to a physical ruler. Once students count grid units consistently, shifting to centimeter measurement on printed diagrams is straightforward. Mixing the two formats across worksheets also prevents unit dependency — students stay attached to the concept rather than to one measurement convention.
What should I do when students keep measuring amplitude instead of wavelength?
Color coding is the fastest fix that holds across a class. Assign one color to vertical measurements (amplitude) and a second color to horizontal measurements (wavelength) for a full class period. Even students who mix up the terms verbally tend to self-correct when the visual channels are separated by color. After one session with color constraints, most students maintain the distinction without it.
Does the set address frequency, or only wavelength?
Frequency appears in the comparison and explanation tasks but is not the primary focus of the set. Students observe that the wave with more cycles in the same horizontal space has a higher frequency and a shorter wavelength — the inverse relationship, presented visually rather than through any formula. For standalone frequency practice, a dedicated set would serve that goal more directly.
Clear All