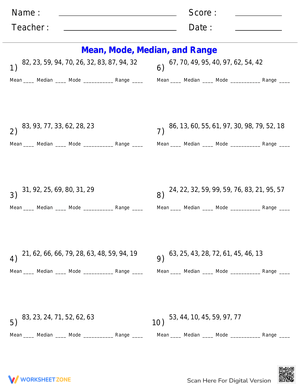
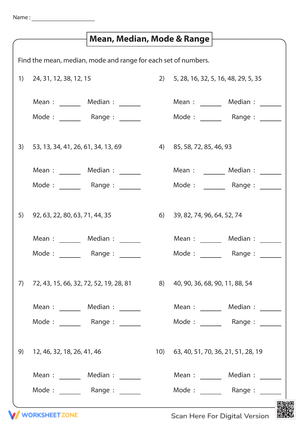
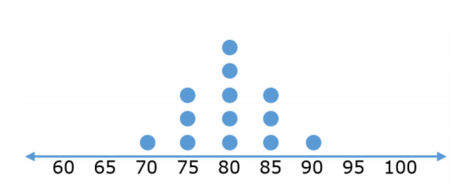
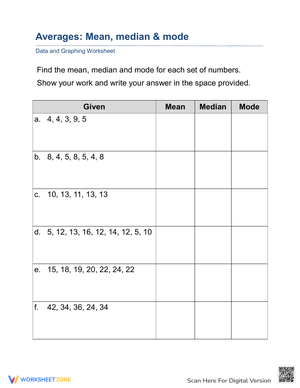
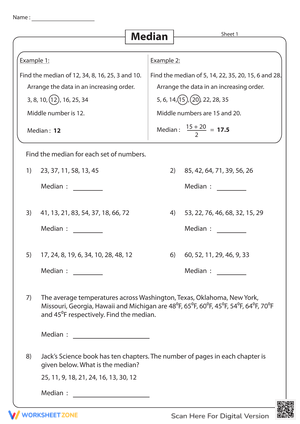
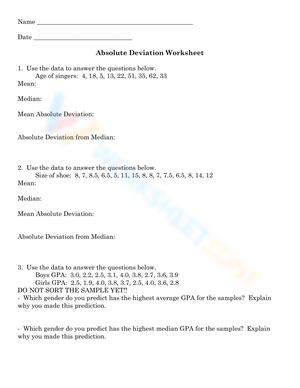
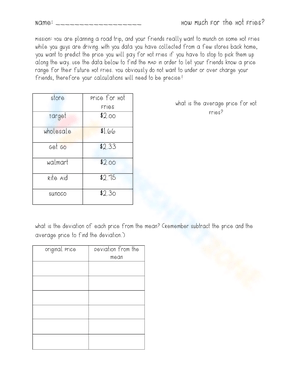
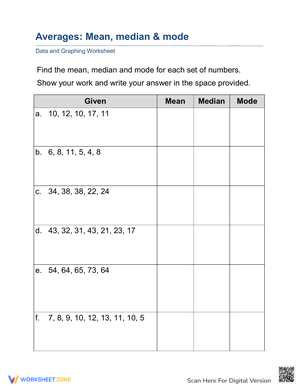
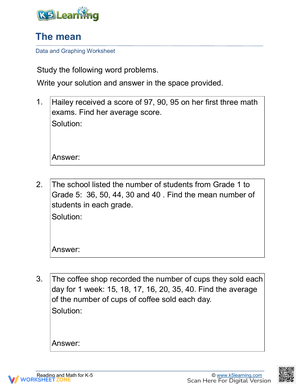
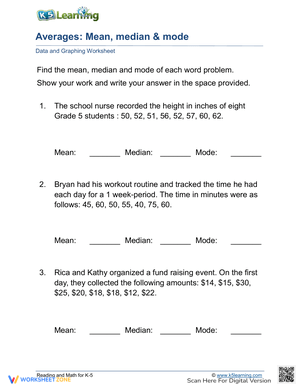
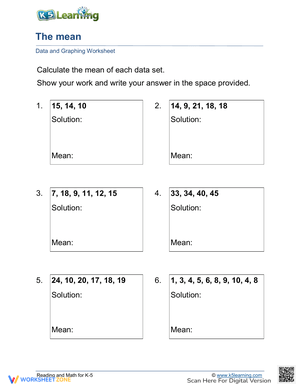
These 6th grade averages pdf worksheets give teachers a ready-to-use set of printable practice that moves students from basic mean computation toward genuine data interpretation. Each worksheet targets the arithmetic mean — what sixth graders are most likely to encounter on unit assessments and state tests — while building the reasoning habits that separate students who understand the concept from those who have only memorized a procedure.
Skills Each Worksheet Builds
The set opens with direct mean problems: students add all values in a data set and divide by the count. That procedure sounds simple, but sixth graders need enough repetition to make those steps automatic before the problems become contextual. The 6th grade averages pdf worksheets in this set are organized to build that fluency first, then layer in word problems, data tables, and interpretation questions once the basic calculation is reliable.
Task types across the set include:
- Calculating the mean of whole-number data sets with four to eight values
- Identifying how many numbers are in a set before dividing — a step that trips up more students than the arithmetic itself
- Comparing mean with median, mode, and range using the same data set
- Working through word problems where data values are embedded in a sentence, not listed in a tidy column
- Explaining what the average tells you about the full group, not just recording the numerical result
That last task — explaining the meaning — separates these worksheets from straight computation practice. A student who can report that the mean quiz score is 82 but cannot say whether most students scored near that number has not fully met what the grade-level standard actually requires.
How to Build These Worksheets Into Your Lesson Plans
The set works best when spread across a week rather than assigned in a single block. A three- or four-problem worksheet on Monday serves as a retrieval check — students surface what they remember before instruction resumes, which is a more efficient use of the first ten minutes of class than going straight into new content. Midweek, a full worksheet combining computation and word problems fits naturally as independent practice after a mini-lesson, while the thinking from that lesson is still fresh. By Friday, a mixed-format worksheet that includes mean alongside median and range shows teachers who has genuinely consolidated the concept and who has been following a memorized routine without understanding it.
One routine that consistently improves accuracy: before dividing, ask students to circle the number of data points. On problems where values are embedded in a sentence instead of listed vertically, students frequently lose track of the count. Circling each value as they read forces them to confirm how many there are before any arithmetic begins. The worksheets leave enough white space for this kind of annotation — students can circle, underline, and label without cramping their written work.
Mistakes Students Make That These Worksheets Help You Catch
The most consistent error in sixth grade average work is division by the wrong count. A student adds five quiz scores correctly, arrives at 415, and then divides by 10 because 10 looks like a clean divisor. The result, 41.5, is clearly off compared to scores in the 70s and 80s, but students who are not checking reasonableness do not catch it. That mistake is almost never a division error — it is a counting error. The student never confirmed how many values were in the set.
Because these errors follow such predictable patterns, 6th grade averages pdf worksheets that require labeled step-by-step work catch mistakes that a short-answer format would miss entirely. Two other patterns appear regularly: students stop after summing the values and treat the total as the answer, and students pick the median — often the middle number in a short list — instead of calculating the mean. Both are visible in student work precisely because these worksheets ask for the steps, not just the answer. A wrong final number that followed correct addition tells you something entirely different than a wrong answer with no work shown at all.
Standard Alignment
These worksheets align with CCSS 6.SP.A.3, which asks students to recognize that a measure of center summarizes an entire data set with a single number and to understand the meaning of that summary in context. In practical terms, that standard requires students to interpret the mean, not just calculate it — which is why the worksheets pair computation problems with short written responses. Teachers working through a data and statistics unit typically place these worksheets after students have encountered the vocabulary of data analysis and before instruction shifts to comparing distributions across two groups.
Adapting This Set for Your Range of Learners
Students who are still developing fluency with multi-digit addition and basic division need a more structured entry point than the mixed-format worksheets provide. Start those students with the straight computation problems — small whole-number sets, no more than five values — and post a visible three-step reminder at the top of their workspace: add the values, count the values, divide. That structure is not a simplification of the math; it is a memory support that holds the sequence in place while working memory is occupied with the calculation itself.
On-level students work through the full set including word problems and comparison tasks. For students who are ready for a greater challenge, the move is richer interpretation, not harder arithmetic. Ask them to determine whether the mean or the median better represents a given data set, then defend that choice in writing. A data set like {4, 5, 5, 6, 47} has a mean of 13.4 and a median of 5 — a student who can explain why the median is more informative there is already reaching into 7th grade statistics. One honest limitation: students with weaker reading fluency often miscount values in word problems not because of math difficulty but because parsing the sentence taxes so much attention that they lose track of what they have already read. Pair those students with a partner for embedded-sentence problems, or read the problem aloud before independent work begins.
Frequently Asked Questions
Are mean and average the same thing at the sixth grade level?
In most grade 6 math lessons, yes — the terms refer to the same calculation. Students add all values in a data set and divide by the number of values. Teachers use both words so students recognize either term on a test, in a textbook, or in worksheet directions.
How long does each worksheet take to complete?
Most worksheets in the set include eight to twelve problems and take between ten and fifteen minutes for an average sixth grader working independently. Computation-only worksheets run shorter; mixed formats with word problems and interpretation questions run closer to the fifteen-minute end. That range makes them flexible across warm-up blocks, full independent practice periods, and homework assignments.
Do these worksheets come with answer keys?
Yes. Each worksheet includes a corresponding answer key. That makes the set practical for math centers, self-checking routines, and homework that teachers can review quickly without re-solving every problem from scratch.
What prior knowledge do students need before using these worksheets?
Students should be comfortable adding multi-digit whole numbers and performing basic division. Familiarity with the terms mean, median, mode, and range helps them follow directions without stopping to decode vocabulary. Students who arrive without that background can still complete the computation worksheets; they will need more direct support on the interpretation tasks. When pulling 6th grade averages pdf worksheets for an intervention group, the computation-focused worksheets in the set are the clearest starting point — the word problems can follow once the basic procedure is solid.













 Interactive Worksheet Maker
 Quiz Maker
 Word Search Maker
 Crossword Puzzle Maker
 Word Scramble Generator
 Sentence Scramble Generator
 Handwriting Worksheet Generator
 Name Tracing Generator
 Fill In The Blank Generator