These predator and prey worksheets for 5th grade move students past basic food chain identification and into the harder analytical work: tracing energy through multi-species food webs, reading population data, and reasoning about what happens to an ecosystem when one species disappears. Each worksheet is a self-contained activity, print-ready and structured so students spend their time thinking rather than decoding directions.
The Specific Skills Targeted
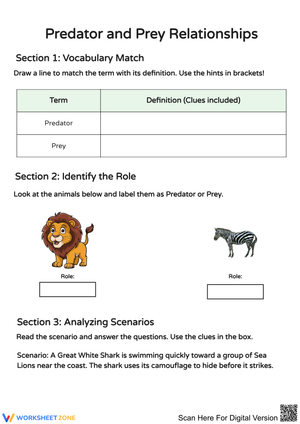
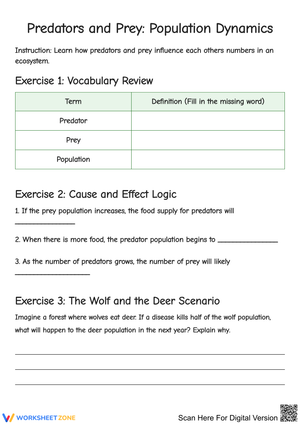
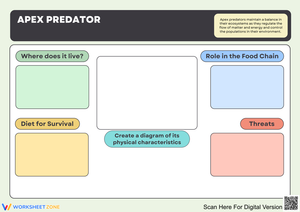
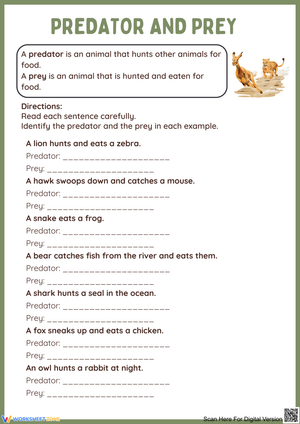
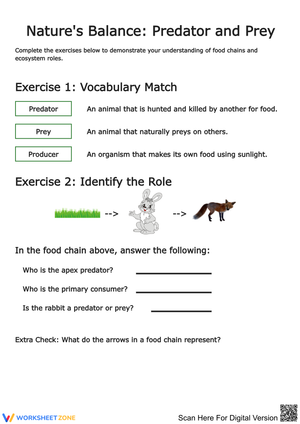
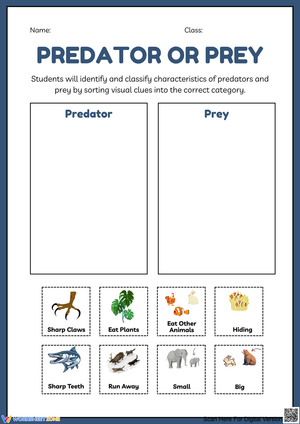
The set covers four distinct lines of work. Food web mapping asks students to draw and label energy-transfer arrows across a full ecosystem diagram — distinguishing herbivore pathways from carnivore pathways, tracing matter from producers up through apex predators. Adaptation match-up worksheets present an organism on one side and a survival trait on the other; students connect them and then write a sentence explaining the mechanism, not just the label. Population dynamics worksheets give students a multi-year data table — lynx and snowshoe hare numbers are the classic pairing — and ask them to plot both populations on a shared graph, then answer questions about the lag between rising prey counts and rising predator counts. Ecosystem scenario worksheets pose a disruption — removal of a top predator, introduction of an invasive species — and ask students to predict the cascade effects, citing evidence from the food web diagrams they built earlier.
Across all four types, students underline key terms, annotate diagrams, rewrite predictions in complete sentences, and mark relationships with directional arrows. The tasks require writing, not just circling or filling blanks.
Standard Alignment
These worksheets align to NGSS 5-LS2-1, which asks students to develop a model describing the movement of matter among plants, animals, decomposers, and the environment. In classroom terms, that standard calls for more than labeling — students need to show flow, predict consequences of disruption, and explain how populations regulate one another. The food web mapping and scenario worksheets address the modeling expectation directly. The population graphing worksheet supports the data-interpretation practices embedded in the NGSS science and engineering practices, specifically analyzing and interpreting data and using mathematics and computational thinking.
Mistakes Students Make That These Worksheets Help You Catch
The most persistent error on food web mapping worksheets is arrow direction. Students know energy moves from prey to predator, but a significant number draw the arrow pointing from predator to prey — following the intuition that the arrow shows "who eats whom" rather than "where energy goes." That reversal is worth addressing explicitly before students begin, because it compounds: a wrongly directed arrow in the middle of a web sends every downstream connection off course.
On population graphing, students routinely assume the predator population rises at the same time as the prey population, rather than recognizing the lag. When asked why predator numbers are still high even after prey numbers have dropped, a common answer is "because predators are stronger." The worksheet's follow-up questions are designed to surface that misconception so you can correct it with the data in front of the student, not in the abstract.
On scenario worksheets, watch for students who predict only one step of a cascade. Asked what happens when wolves are removed from Yellowstone, they'll write "deer numbers increase" and stop — missing that increased deer browsing then reduces riparian vegetation, which affects stream temperature, which affects fish. Modeling complete cascades is precisely what NGSS 5-LS2-1 asks for, so the scenario prompts push students to extend their predictions at least two steps.
How to Build These Worksheets Into Your Lesson Plans
A brief physical simulation before students pick up their pencils dramatically improves the quality of written responses. Assign groups roles — producers, prey species, predators — and run a two-minute tag activity in the hallway. When students return to their seats, the arrows on a food web diagram represent movement they just experienced. Teachers report that students complete the analytical questions faster and with more specific language after the simulation, because they have a concrete reference point rather than an abstract diagram.
Station rotation works well for covering multiple worksheet types in a single period. Set up four stations, one for each worksheet format, and rotate groups every 10 to 12 minutes. That structure keeps pace brisk and exposes every student to the full range of task types — mapping, matching, graphing, and scenario analysis — before the unit assessment.
For exit tickets after any worksheet in the set, ask students to write one sentence connecting what they just did to the idea that matter cycles through ecosystems. That sentence tells you immediately who understood the underlying principle and who completed the task mechanically without connecting it to the broader concept.
Adjusting the Worksheets for a Range of Learners
For students who need more support, pre-fill a portion of the food web diagram — label the producers and one consumer level — so they can focus on completing the logic rather than building the structure from scratch. A vocabulary bank printed at the top of the worksheet removes the barrier of term retrieval without removing the thinking. For students ready to go further, the scenario worksheets accept open-ended additions: ask them to research a documented case of predator reintroduction, such as wolves returning to Yellowstone in 1995, and write a paragraph comparing the actual outcomes to their predictions. That extension ties the worksheet activity to real conservation science without requiring a separate assignment.
Frequently Asked Questions
Do these worksheets work as standalone lessons or only within a full ecosystems unit?
Each worksheet functions independently as a single-period activity, but the scenario analysis worksheets assume students can already read a food web diagram. If you're pulling one worksheet outside the sequence, the food web mapping activity is the strongest standalone choice — it builds the foundational diagram that several other tasks reference.
How do I handle the predator-prey graphing worksheet if students' math skills are behind grade level?
Provide a pre-scaled graph with axes already labeled and intervals marked. That removes the scaling step — which is a math skill, not a science skill — without removing the interpretive work of plotting points and reading trends. Students who need the math support can still answer the analysis questions at full rigor.
Is the dual-role concept — an animal being both predator and prey — too abstract for all 5th graders?
It's concrete once you use a familiar example. A frog eats insects but is eaten by a heron. A heron catches fish but can be taken by a large hawk. Walking through a two-step chain like that before students begin the worksheet clears up the confusion for most of the class. The misconception that "predator" and "prey" are fixed identities rather than relational labels is worth addressing directly — it's exactly what the dual-role questions on the matching worksheet are designed to probe.