These 3rd grade earth and spaces worksheets printable resources give teachers a concrete bridge between what students notice outside and the vocabulary, data skills, and explanatory thinking Grade 3 Earth science requires. The set spans four connected domains: weather data collection and graphing, weather versus climate, the Earth-Sun-Moon system, and engineering responses to natural hazards. Each worksheet stands on its own, so teachers can slot individual resources into science stations, warm-up blocks, or review days without running the full set in sequence.
Skills and Concepts Each Worksheet Targets
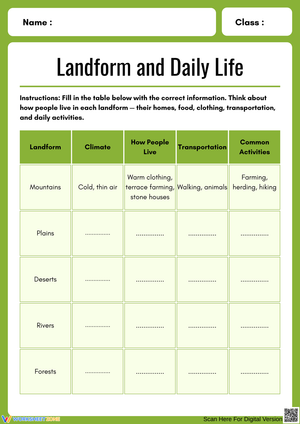
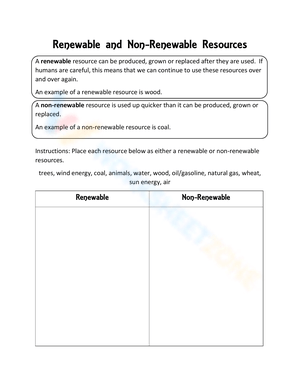
Within this 3rd grade earth and spaces worksheets printable set, the weather strand has students record temperature, precipitation, and cloud cover in structured logs, then transfer that data into bar graphs and tables — a direct match for the data representation work 3-ESS2-1 requires. The climate strand uses sorting activities and comparison charts to separate short-term weather events from long-term regional patterns, with map-based worksheets introducing polar, temperate, and tropical zones through descriptions students annotate and compare. These two strands are often taught in parallel because the misconceptions around each tend to cross-pollinate — students who conflate weather and climate also tend to misread their own weather data.
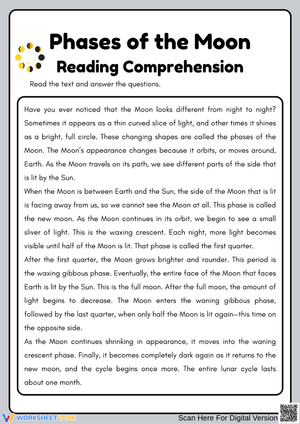
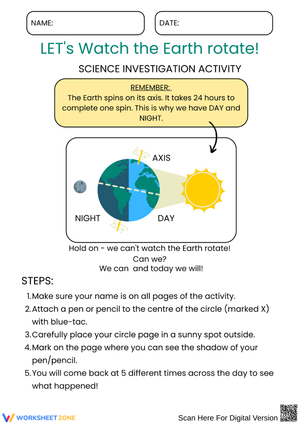
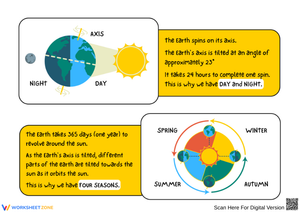
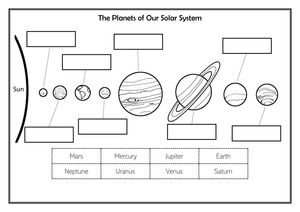
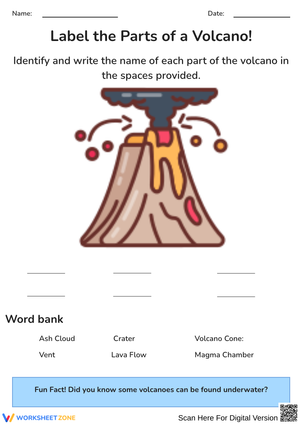
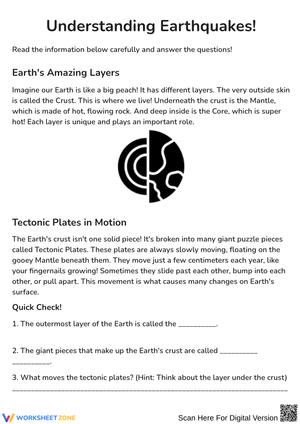
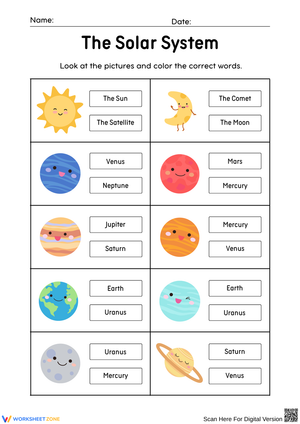
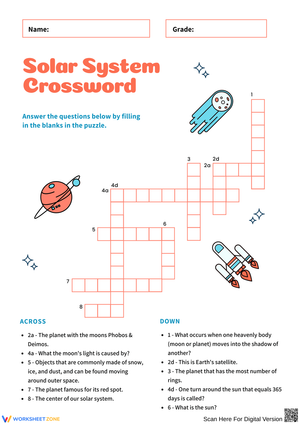
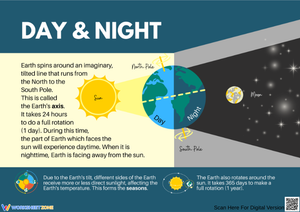
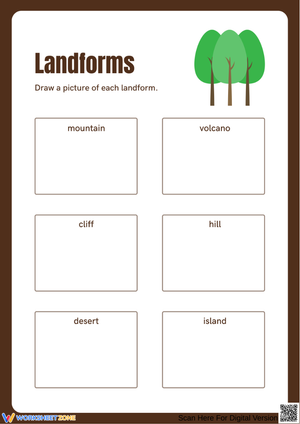
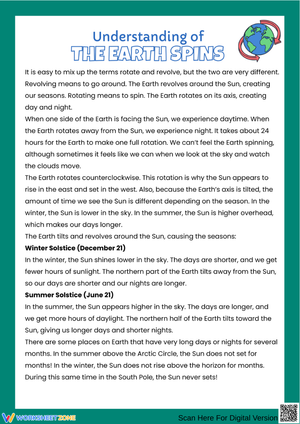
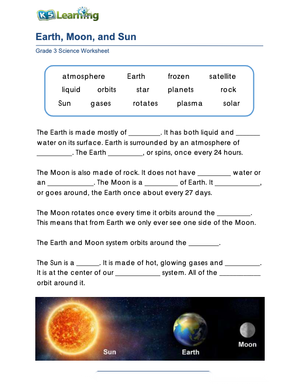
The Earth-Sun-Moon strand moves through three connected ideas: day and night from Earth's rotation, moon phases from orbital viewing angle, and seasons from axial tilt. Students complete labeled diagrams, mark orbital positions, and use a monthly calendar grid to log observed moon phases over roughly four weeks. The natural hazards strand uses scenario-based tasks where students evaluate and compare design solutions for flooding, high winds, and lightning — identifying tradeoffs before selecting or sketching an approach.
Three Misconceptions That Show Up Reliably in This Unit
The season-distance error appears in almost every class. Students explain summer as the Earth moving closer to the sun — a conclusion that follows its own logic and gets reinforced by nothing in daily experience contradicting it. Earth-Sun-Moon diagram worksheets counter this by asking students to label the axial tilt at two opposite orbital positions and then write, in their own words, why the Northern Hemisphere has summer when Earth is actually farther from the sun at that point. The writing prompt matters: students who select the correct answer on a multiple-choice item will often still hold the distance model the moment they have to explain.
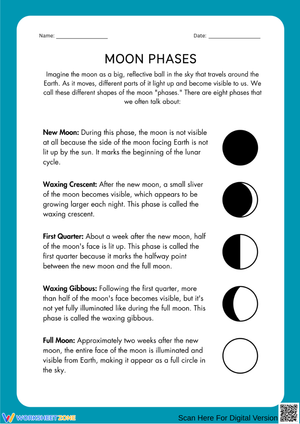
Moon phases produce a second persistent error: students assume the dark portion of the moon is Earth's shadow, confusing phases with lunar eclipses. The bird's-eye-view diagram — Earth, Sun, and Moon laid out from above with the Moon at eight orbital positions — shifts the mental model from obstruction to viewing angle. Without that spatial reframe, the monthly observation calendar fills with data students cannot interpret correctly. The third error is weather-climate conflation: a single unseasonable week becomes, in a student's reasoning, proof of the regional climate. The sorting worksheets address this directly, and they work best when you include deliberate outlier scenarios — a record snowfall in a tropical region, a dry stretch in a normally wet climate — that force students to reason from long-term pattern rather than a single event.
Working These Worksheets Into Your Science Block
The weather logs work best as a sustained classroom routine rather than a one-time activity. Appointing a daily meteorologist — one student who reads the outdoor thermometer, checks the sky, and fills in that morning's row before morning meeting wraps — turns the log into a genuine data set over four weeks. When students reach the graphing worksheet at month's end, they are plotting data they collected, not numbers someone handed them. That difference matters: students read their own graphs more carefully and notice patterns they want to explain. These 3rd grade earth and spaces worksheets printable logs are easy to display as a running classroom record, which keeps weather data visible during discussions about climate and seasonal patterns.
The natural hazards worksheets are more effective after ten minutes examining actual images — flood damage to a neighborhood, a collapsed structure after a windstorm — before students evaluate solutions on the worksheet. Running it cold tends to produce surface-level answers. The moon calendar is the one resource that spans several weeks and depends on home observation; a brief parent note explaining what to look for significantly reduces blank-entry rates. Students who miss several nights can still complete the pattern-identification tasks using the provided moon phase image sequence rather than personal observations.
Standard Alignment
The set addresses three NGSS performance expectations for Grade 3 Earth's Systems:
- 3-ESS2-1 — representing data in tables and graphical displays to describe typical weather conditions — targets the weather logging and graphing resources directly.
- 3-ESS2-2 — obtaining and combining information to describe climates in different regions of the world — drives the climate zone comparison and map annotation worksheets.
- 3-ESS3-1 — making a claim about the merit of a design solution that reduces the impacts of a weather-related hazard — is addressed by the natural hazards scenario worksheets.
The Earth-Sun-Moon materials connect to the crosscutting concept of patterns and support the observational astronomy thread running through the K-5 NGSS progression. Moon phases and seasons are not housed in a standalone Grade 3 performance expectation but feed forward into middle school space systems — worth noting when students ask why the topic appears at this grade.
Adapting Each Worksheet Across Ability Levels
For students who need more support with data representation, pre-filling graph axes and supplying a word bank for labels removes enough production demand that students can demonstrate whether they actually understand the data — which is the learning goal. Students who struggle to build a table from scratch are often fully capable of reading and interpreting one; use a completed example to check comprehension before asking them to construct their own. For moon phases, pairing the observation calendar with a printed sequence of eight phase images removes the vocabulary barrier and lets students focus on recognizing the pattern before attaching names to each phase.
Students who move quickly through the weather-climate sorting tasks are ready for a harder version of the same concept: provide 30-year average temperature and precipitation figures for two unnamed cities and ask them to identify the climate zone using only the numbers. No labels, no visual cues — just reasoning from data to classification. That task calls on the same underlying knowledge as the sorting worksheet but strips away the cues that make classification easy. For natural hazards, the extension is having students evaluate solutions against specific criteria — cost, number of households protected, installation time — rather than simply selecting a preferred option.
Frequently Asked Questions
Do the weather log worksheets connect to math standards?
Yes. Recording temperature readings and plotting them as bar graphs overlaps directly with 3.MD measurement and data standards — specifically representing and interpreting data in scaled graphs. Teachers who run math and science in separate blocks often use the weather graphing worksheet as the math application task, then return to it during the science unit on weather patterns. The data work is identical in both contexts, which makes this one of the cleaner cross-curricular connections at this grade level.
How long does the moon observation calendar take to complete?
The calendar runs roughly 28 days — the full lunar cycle. Most teachers launch it during the first week of the Earth-Sun-Moon unit so the completed observation data is ready for pattern analysis and graphing activities near the unit's end. Plan for gaps: cloudy nights, missed nights, and absences all produce blank entries. Have the phase image sequence available so students can fill in missing observations before moving to the graphing worksheet.
Which worksheets work well as formative checks mid-unit?
The weather-versus-climate sorting worksheet functions as a strong formative check after the first week, before students move on to climate zones. It surfaces who still treats a single weather event as evidence of regional climate and who has genuinely internalized the time-scale distinction. The Earth-axis labeling diagram serves the same function midway through the Earth-Sun-Moon strand — looking at how students explain tilt versus distance tells you who still holds the distance-seasons model. Neither needs to be graded formally; scanning completed worksheets for those specific errors gives you what you need to adjust instruction the next day.
How do the engineering design worksheets address 3-ESS3-1?
These 3rd grade earth and spaces worksheets printable resources present engineering tasks as scenario-based evaluation rather than open-ended build challenges. Students read a description of a community facing a specific hazard — a coastal town prone to storm surge, a valley at risk of flash flooding — examine two or three proposed solutions, and then write a claim with evidence for which solution has greater merit. That format matches the performance expectation's language directly: "make a claim about the merit of a design solution." Students get the evaluative practice 3-ESS3-1 prioritizes without needing materials, build time, or a dedicated makerspace setup.