These exponential growth and decay worksheets printable for 10th grade give teachers a focused set of practice tools at the exact point in the curriculum where students move from linear models to rate-based change — a conceptual shift that catches a surprising number of students off guard. Each worksheet targets a specific skill: building the equation from a word problem, converting a percentage rate to a growth or decay factor, graphing the resulting curve, or comparing exponential behavior against a linear model side by side. Teachers get resources that work as guided class practice, independent homework, or quick formative checks at the end of a period.
What's Inside the Set
The worksheets cover five areas that 10th grade Algebra I and II courses consistently address during an exponential functions unit.
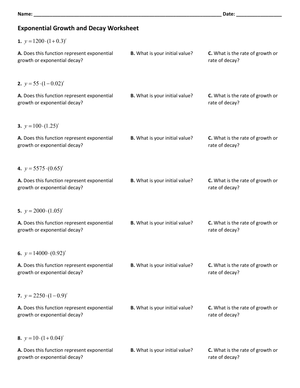
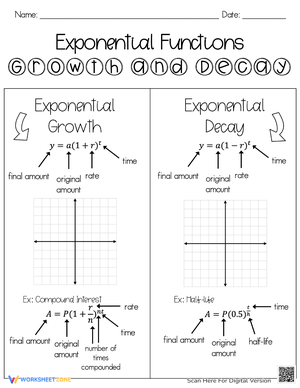
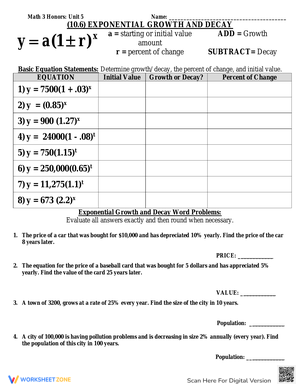
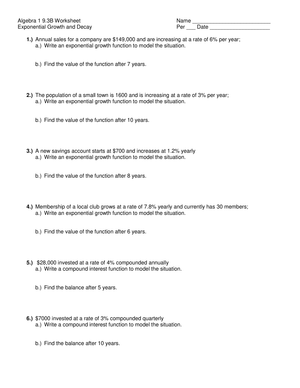
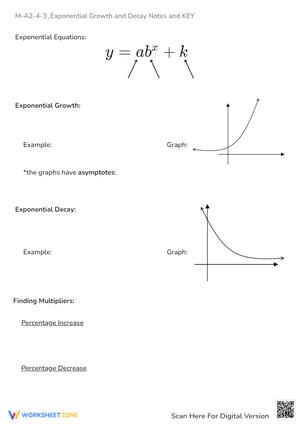
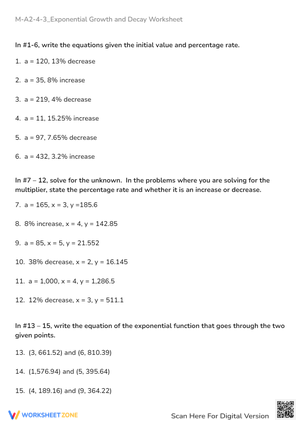
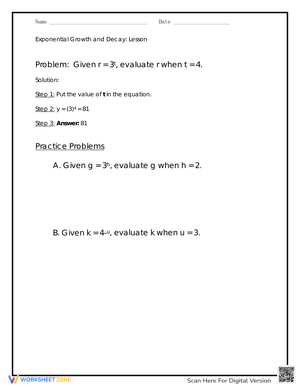
- Formula setup from context: Students extract the initial value and percentage rate from a word problem, convert the rate to a decimal, and write the equation y = a(b)^t — identifying whether b is greater than 1 or between 0 and 1.
- Rate-to-factor conversion: Dedicated practice translating a percentage rate into its corresponding growth or decay factor, which isolates the step where most students stumble before anything else in the unit.
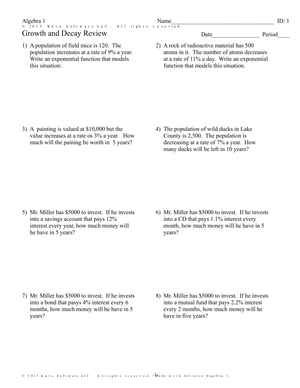
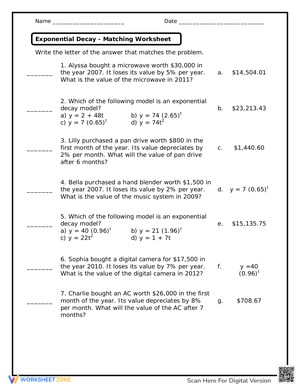
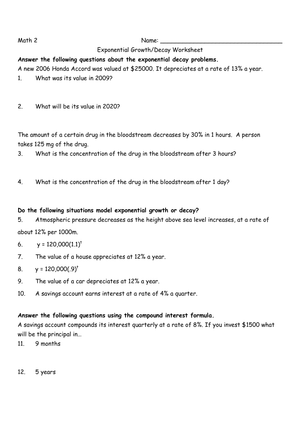
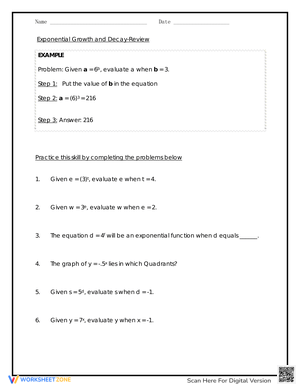
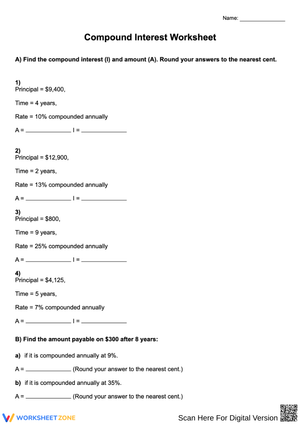
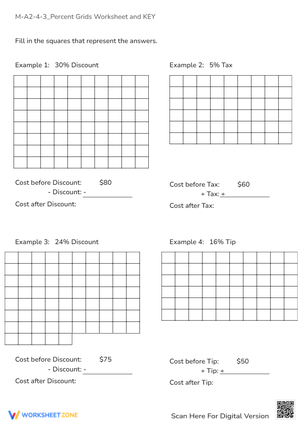
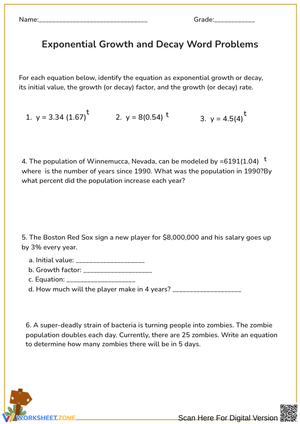
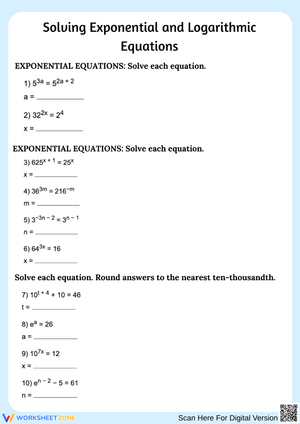
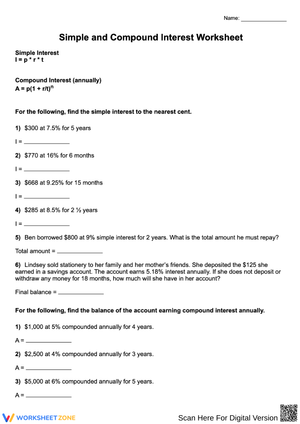
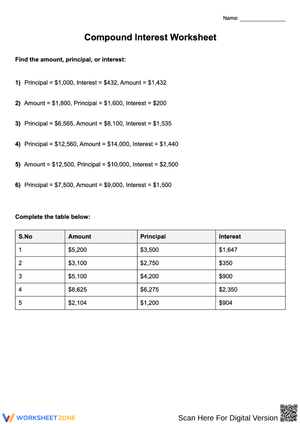
- Substitution and solving: Given a complete equation and a value for t, students calculate the resulting quantity — compound interest balances, projected populations, or remaining radioactive material after a set number of half-lives.
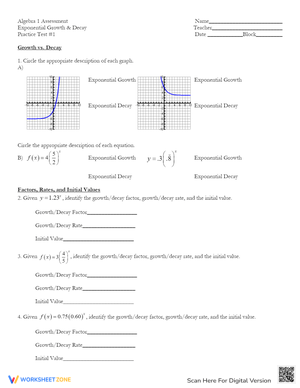
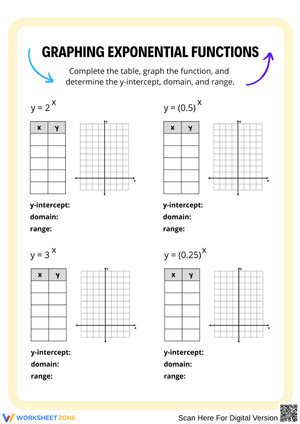
- Graphing: Students plot exponential functions from a table of values, sketch the curve, label the y-intercept, and identify the horizontal asymptote.
- Linear vs. exponential comparison: Mixed tables and word problems require students to decide which model applies before writing any equation at all.
Where Real-World Contexts Show Up
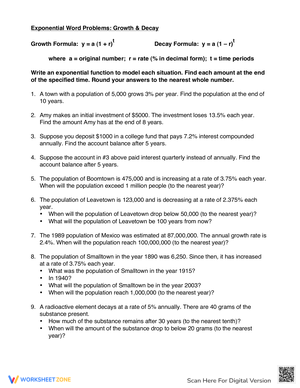
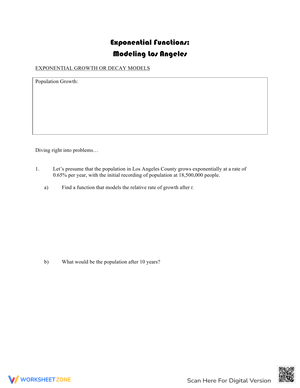
Word problems across the set draw from three main areas: finance, population change, and physical science. Compound interest problems let students calculate how an initial deposit grows at a given annual rate — and these problems open up natural financial literacy conversations that go beyond the math. Population problems include both growth scenarios (a town expanding at 3.2% per year) and decline scenarios (a wildlife population dropping after habitat loss). Half-life problems model radioactive decay or drug concentration in the body and use the same formula structure, which reinforces for students that the underlying math does not change when the context does.
What these contexts share is that they require interpretive work before the formula comes out — reading for initial value, direction of change, and time interval. That translation from words to equation is where many students stall, and working through multiple contexts is what builds the flexibility to handle an unfamiliar word problem on a test.
Fitting These Worksheets Into a Unit Sequence
The rate-to-factor conversion worksheets work best as guided class practice on day two or three of the unit, once students have seen the formula but before they tackle full word problems independently. Walking through two or three problems together — naming each piece of the equation aloud before writing it down — gives students a mental checklist they can replicate on their own. The word problem worksheets that follow are strong candidates for homework because the solving step is mechanical once the setup is correct; errors at home almost always trace back to the setup, which makes them easy to address at the start of the next class.
These exponential growth and decay worksheets printable for 10th grade also work well structured as station activities. Cutting the word problems from one worksheet and distributing them across three or four stations — one for compound interest, one for population, one for half-life — lets students move around while keeping the underlying math consistent. Teachers can cluster by problem type for students who need more exposure to a particular context, or mix types across stations for students who are ready to transfer the skill without contextual clues.
Student Errors Worth Anticipating Before They Calcify
The most persistent error at this level is treating the rate and the factor as interchangeable. A student who knows the annual growth rate is 6% will write b = 0.06 instead of b = 1.06, then produce a decay curve from a growth problem without realizing anything is wrong. Repeating the rule does not fix this — asking the student to reason about it does. "If the account grew, should your multiplier be more than 1 or less than 1?" That question moves students from pattern-matching to proportional thinking.
A related error appears with decay problems. Students who correctly identify the decay rate (say, 0.15 for a 15% annual loss) then write b = 0.15 rather than b = 0.85 — they use the number they just found as the base. Reframing the problem helps: the object retains 85% of its value each period, so the multiplier is 0.85. Thinking about what remains, rather than what is lost, leads directly to the correct factor and skips the mechanical confusion of computing 1 minus the rate.
On graphing worksheets, watch for students who draw the decay curve touching the x-axis and then running flat as a horizontal line at y = 0. They understand conceptually that the quantity approaches zero — they just model it incorrectly. Asking students to compute specific y-values at large values of t (t = 30, t = 50) and seeing that the output is very small but still positive usually corrects the sketch faster than any explanation about asymptotes.
Adjusting the Set for Students at Different Entry Points
Students who are still shaky on percent-to-decimal conversion will stall on these worksheets immediately, because that conversion is a prerequisite — not something the exponential content teaches on its own. For those students, a quick reference table of common rates and their decimal equivalents included during guided practice removes that barrier without lowering the demand of the actual exponential work. The goal is to keep cognitive load focused on the new concept, not on a skill that should already be automatic.
For students who move through the formula-setup problems quickly, the linear-vs.-exponential comparison worksheets carry the most analytical weight. Asking those students to write a brief explanation of how they determined which model to use — not just circling an answer — pushes them toward the reasoning that shows up on performance tasks. The exponential growth and decay worksheets printable for 10th grade in this set include open-response extension problems at the bottom of several worksheets that serve this purpose without requiring teachers to build separate enrichment materials.
Standard Alignment
These worksheets align with the Common Core High School Functions domain, specifically the Linear, Quadratic, and Exponential Models cluster. CCSS.MATH.CONTENT.HSF.LE.A.1 asks students to distinguish between situations modeled by linear and exponential functions — the comparison worksheets in the set address this standard directly. CCSS.MATH.CONTENT.HSF.LE.A.2 requires constructing exponential functions from verbal descriptions or given data, which maps to the word-problem setup worksheets. CCSS.MATH.CONTENT.HSF.LE.B.5 focuses on interpreting parameters in context — connecting the values of a and b in the equation back to the real-world meaning of initial amount and rate of change.
The exponential growth and decay worksheets printable for 10th grade in this set address all three standards across distinct worksheet types, which lets teachers pull specific worksheets based on their current instructional focus rather than working through the entire set in sequence.
Frequently Asked Questions
How do you tell from the base alone whether a function models growth or decay?
In the equation y = a(b)^t, if b is greater than 1, the function models growth — each multiplication produces a larger output than the step before it. If b falls between 0 and 1 (a positive decimal less than 1), the function models decay — each multiplication reduces the quantity. The base must always be positive; a negative base does not produce a valid exponential model in these contexts.
What is the difference between the growth rate and the growth factor?
The growth rate (r) is the percentage change expressed as a decimal. The growth factor (b) is the multiplier that goes into the equation — equal to 1 + r for growth or 1 − r for decay. A 7% annual growth rate means r = 0.07, so b = 1.07. This distinction is worth significant class time because equation-setup errors almost always start here.
Why does an exponential decay curve never reach zero?
Every step in exponential decay involves multiplying by a positive fraction. Multiplying any positive number by a positive fraction produces another positive number — smaller each time, but never zero. The x-axis acts as a horizontal asymptote: the curve approaches it indefinitely without touching. It is a meaningful place to first introduce the idea of a limit, which students will encounter again with rational functions and, eventually, in calculus.
Can these worksheets be used for review before an end-of-unit assessment?
Yes. The rate-to-factor conversion worksheets and the word-problem setup worksheets are particularly useful for pre-assessment review because they target the two error types most likely to cost students points. Using two or three problems from those worksheets as a daily warm-up in the days leading up to a test — spaced retrieval rather than a single long review session — produces more durable recall of the setup process.