These 10th grade graphing quadratic functions pdf worksheets give Algebra teachers structured practice for the point in the semester when students first confront parabolas — a transition that reliably exposes gaps between algebraic manipulation and visual reasoning. Each worksheet targets a distinct piece of the graphing process, so teachers can use them individually as warm-ups or deploy the full set across a unit.
The Specific Skills Covered in Each Worksheet
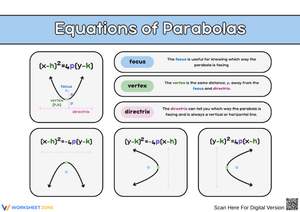
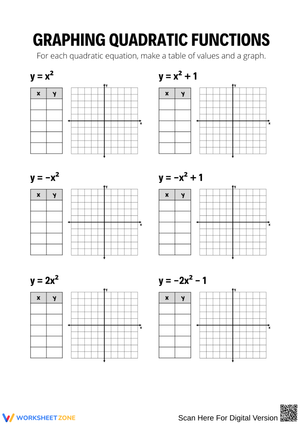
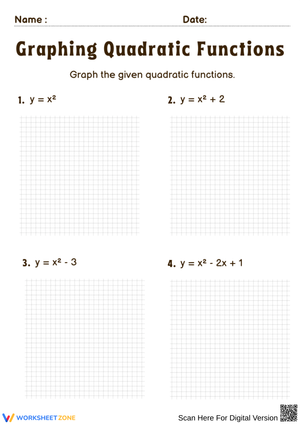
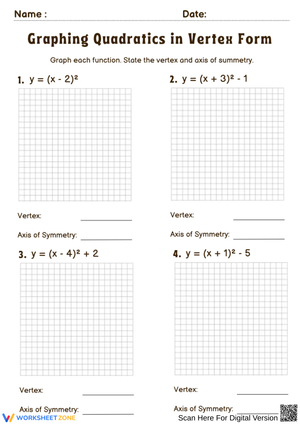
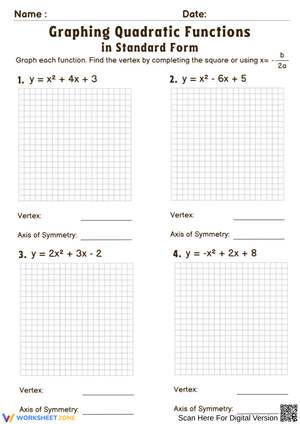
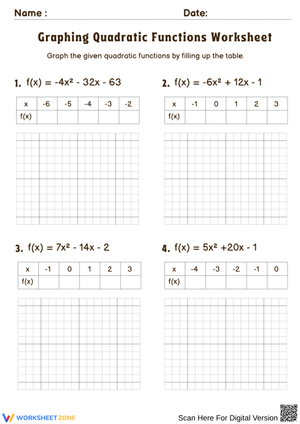
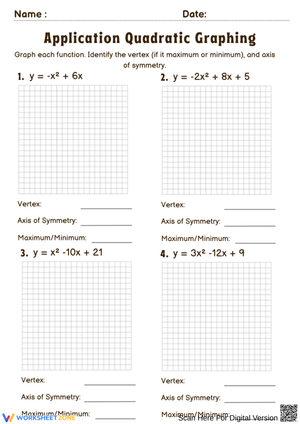
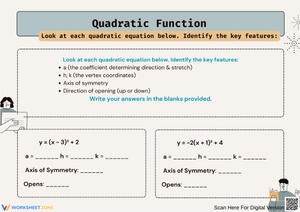
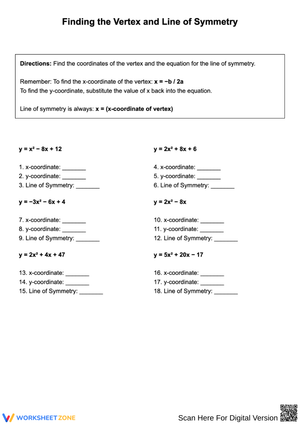
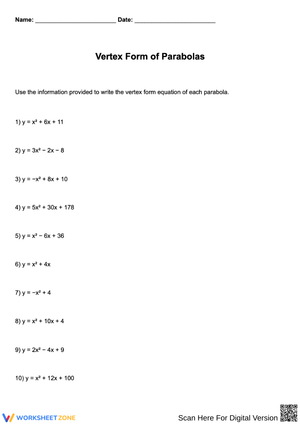
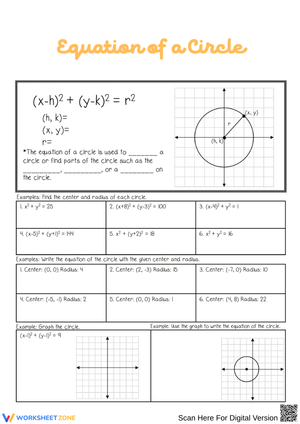
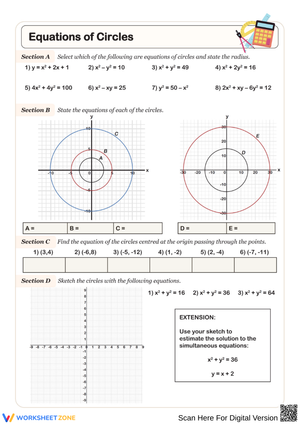
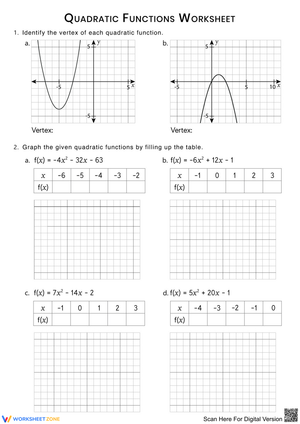
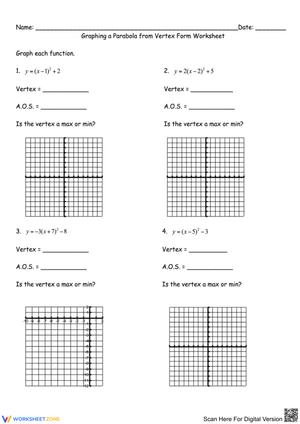
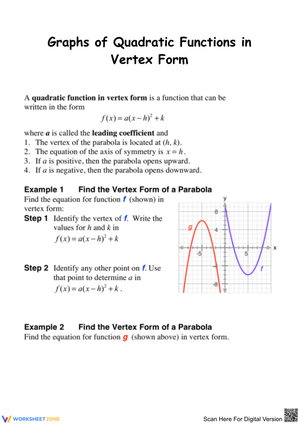
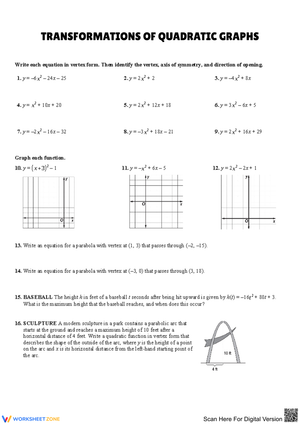
The 10th grade graphing quadratic functions pdf worksheets in this collection work across all three algebraic forms students encounter at this level: standard form y = ax² + bx + c, vertex form y = a(x − h)² + k, and factored form y = a(x − p)(x − q). Students practice extracting key information from each form before any plotting begins — determining the direction of opening from the leading coefficient, locating the vertex through formula or direct reading, and identifying intercepts. Every worksheet also requires students to state domain and range after completing the graph, which closes a gap that surfaces regularly on unit assessments.
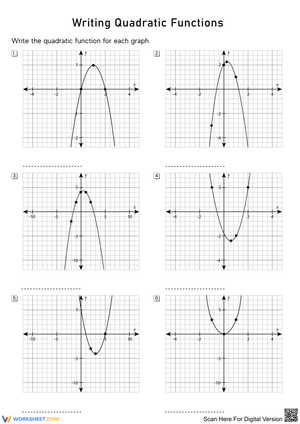
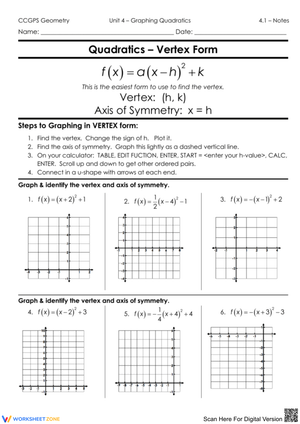
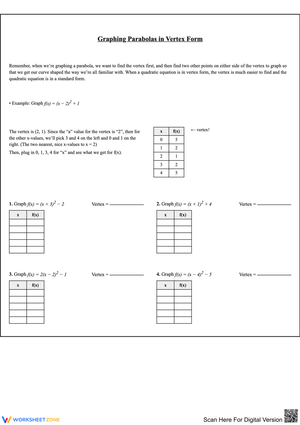
The graphing sequence stays consistent across the set: identify the vertex and axis of symmetry, build a table of values centered on the vertex with at least five points, plot those points, sketch the curve, and label all key features. That labeling step matters — a finished graph with no labeled vertex or intercepts tells the teacher nothing about whether the student understood what they were drawing.
Mistakes Students Make When Graphing Parabolas
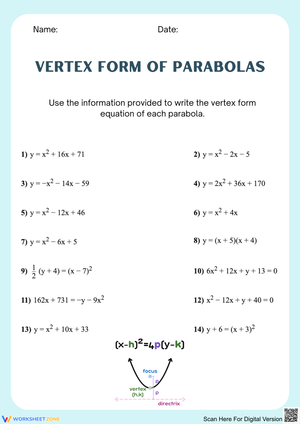
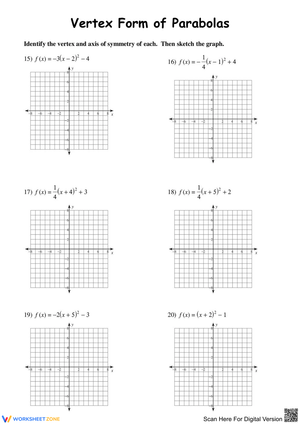
The most predictable error in vertex form work is the sign flip on h. When students see y = (x − 3)² + 2, a significant portion write the vertex as (−3, 2). The subtraction sign inside the binomial reads as a negative to them, and they apply it to the coordinate rather than recognizing it as structural syntax. Introducing vertex form with positive values of h first — before negative values enter the picture — slows this habit from forming.
A second recurring problem appears when the leading coefficient is a fraction. Students graphing y = (1/3)x² who choose x = 1, 2, 3 immediately get fractions and disengage. The fix is direct: prompt students to choose x-values that are multiples of the denominator. Worksheets that include this prompt alongside the equation produce cleaner student work and fewer complaints about arithmetic.
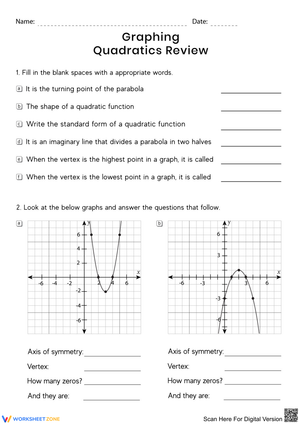
Students also write "all real numbers" for both domain and range, carrying over the pattern they learned with linear functions. Range is bounded for quadratics — restricted at the vertex y-coordinate — and each worksheet includes a dedicated domain-and-range row in the completion table to force students to make that distinction explicitly rather than defaulting to what they already know.
Why This Format Supports Graphing Work at This Grade Level
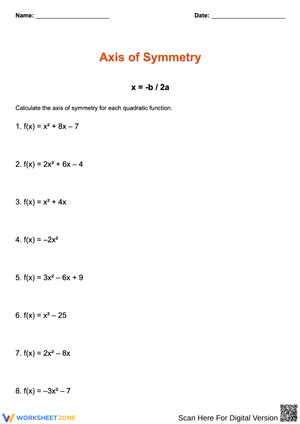
Students can execute the graphing procedure — plot five points, connect the dots — without grasping what makes those points predictable. The worksheet format here disrupts that by requiring students to write the axis of symmetry equation before building their table of values. Once they see that every point has a mirror image across that axis, the table becomes a reasoning tool rather than a computation burden: calculate one side, reflect the other.
A concrete technique pairs well with these worksheets: after students plot their points, have them fold the paper along the axis of symmetry before drawing the curve. If a plotted point doesn't land on its mirror, the student catches the arithmetic error immediately — visible in the physical fold — rather than burying it under a finished sketch. Students who use this check consistently produce more accurate graphs within the first two days of practice.
Standard Alignment
These worksheets address CCSS HSF-IF.C.7a, which requires students to graph quadratic functions by hand and identify intercepts, maxima, and minima. In classroom terms, that standard means students must demonstrate — on paper — that they can extract and plot each key feature from both standard and vertex form equations. The transformation-focused worksheets additionally connect to CCSS HSF-BF.B.3, which covers the effect on a graph of replacing f(x) with f(x) + k, kf(x), and f(x + k). Those worksheets ask students to graph the parent function alongside the transformed version on the same coordinate grid, making the effect of each parameter directly visible rather than abstractly described.
Where These Worksheets Fit Across a Quadratic Functions Unit
The 10th grade graphing quadratic functions pdf worksheets in this set divide naturally across a unit. Use the standard form worksheets during the first week when students are learning the vertex formula; hold the vertex form worksheets for the second week when transformations enter the picture. The factored form worksheet works well as a bridge between graphing and solving — students see x-intercepts written directly into the equation before they formally solve by factoring, which makes the connection between roots and graphical intercepts concrete.
For a collaborative lesson, assign different quadratic equations to table groups and have each group graph their function on chart paper. A gallery walk comparing the results gives students simultaneous exposure to multiple parabolas with varying a, h, and k values — something sequential individual seatwork doesn't achieve as efficiently. The domain-and-range worksheets work well as Friday synthesis material, since they ask students to interpret completed graphs rather than generate new ones, which suits the end of a week when the goal is consolidation rather than new procedure acquisition.
Matching Each Worksheet to Your Students' Readiness Level
Students who struggle with algebraic manipulation before they even reach the graph benefit from starting with vertex form equations exclusively. Vertex form removes the x = −b/(2a) calculation entirely — the vertex coordinates appear directly in the equation, so students place all their attention on the graphing itself rather than splitting it between two separate procedures. Once those students can graph accurately from vertex form, introducing standard form adds the vertex formula as a single new layer.
On-grade students work with standard form equations that include at least one non-integer coefficient. Advanced students receive standard form equations with fractional leading coefficients and no clean factoring path, requiring them to complete the square to convert to vertex form before graphing. That conversion adds a meaningful challenge without changing what the worksheet ultimately asks students to produce.
Frequently Asked Questions
Can these worksheets be assigned before vertex form has been formally introduced?
Yes. Because each worksheet is standalone, teachers can assign only the standard form set during early instruction and hold the vertex form worksheets until that algebraic form appears in the curriculum. Nothing in the standard form worksheets references vertex form syntax, so there is no prerequisite knowledge gap to manage.
Are the coordinate grids pre-scaled to match the equations on each worksheet?
Each worksheet includes a coordinate grid scaled to the functions given, so the vertex, intercepts, and at least two additional plotted points on each side of the axis fall visibly within the grid. Students are not making scale decisions — that has already been handled — which keeps the cognitive demand on the graphing task itself rather than on grid setup.
How do these worksheets connect to state algebra assessments?
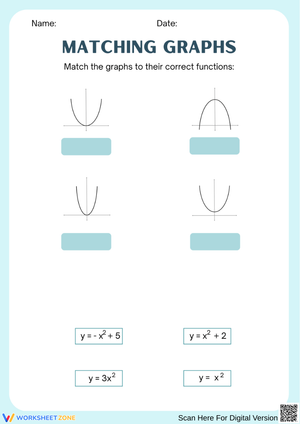
State assessments at this grade level consistently include items asking students to identify the vertex from a graph, match a quadratic equation to its parabola, or determine the axis of symmetry from a given equation. The 10th grade graphing quadratic functions pdf worksheets build exactly the fluency those items test — students who have worked through the set recognize parabola features under time pressure without reconstructing procedures from the beginning.
Do the answer keys show intermediate steps or just finished graphs?
Each worksheet comes with a completed answer key showing the finished graph, all labeled features, and the domain and range entries. For vertex form worksheets, the key also shows the intermediate step of identifying h and k before the table of values, which helps teachers trace exactly where a student's work diverged from the correct process rather than only identifying that the final graph is wrong.