


1 / 2
0
Views
0
Downloads
0.0
0
Save
0 Likes
Introduction to Specific Heat Capacities Worksheet
0 Views
0 Downloads
Paste this activity's link or code into your existing LMS (Google Classroom, Canvas, Teams, Schoology, Moodle, etc.).
Students can open and work on the activity right away, with no student login required.
You'll still be able to track student progress and results from your teacher account.
Information
Description
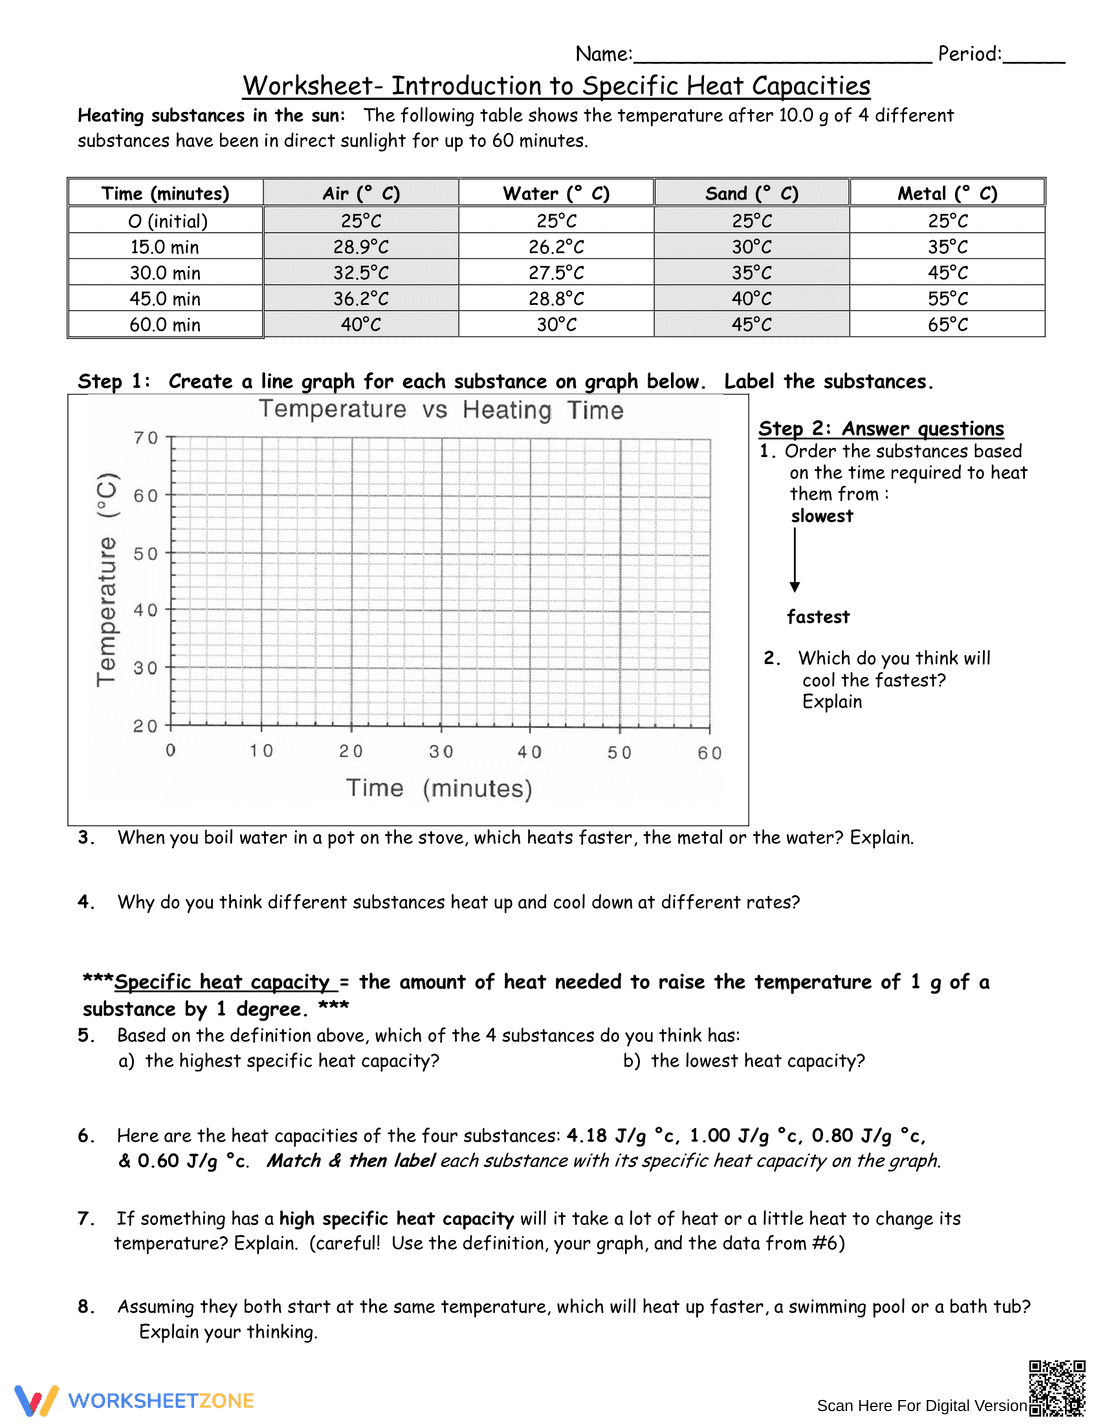
What It Is:
This is a worksheet titled 'Introduction to Specific Heat Capacities'. It includes a table showing the temperature change of four substances (Air, Water, Sand, Metal) when heated by sunlight over 60 minutes. Students are instructed to create a line graph of temperature vs. time for each substance. The worksheet also contains questions related to heat capacity, heating rates, and cooling rates, including ordering substances by heating time, explaining cooling rates, and relating specific heat capacity to temperature change. The definition of specific heat capacity is provided. The worksheet also includes the specific heat capacities of the four substances for matching.
Grade Level Suitability:
This worksheet is suitable for grades 7-9. It involves graphing, data analysis, and understanding basic concepts of heat transfer and specific heat capacity, which are typically introduced in middle school science courses.
Why Use It:
This worksheet helps students visualize and understand the concept of specific heat capacity by analyzing real data. It allows them to practice graphing skills, interpret data tables, and make connections between specific heat capacity and the rate at which different substances heat up or cool down. It reinforces the definition of specific heat capacity and its implications.
How to Use It:
First, students should plot the data from the table onto the provided graph, creating separate lines for each substance. They should then answer the questions based on their graph, the data table, and the provided definition of specific heat capacity. Students should match the provided specific heat capacity values to each substance. Finally, they should explain their reasoning for the open-ended questions.
Target Users:
This worksheet is designed for middle school science students learning about heat transfer, specific heat capacity, and the properties of matter. It is also useful for teachers looking for a hands-on activity to reinforce these concepts.