




























Views
Downloads
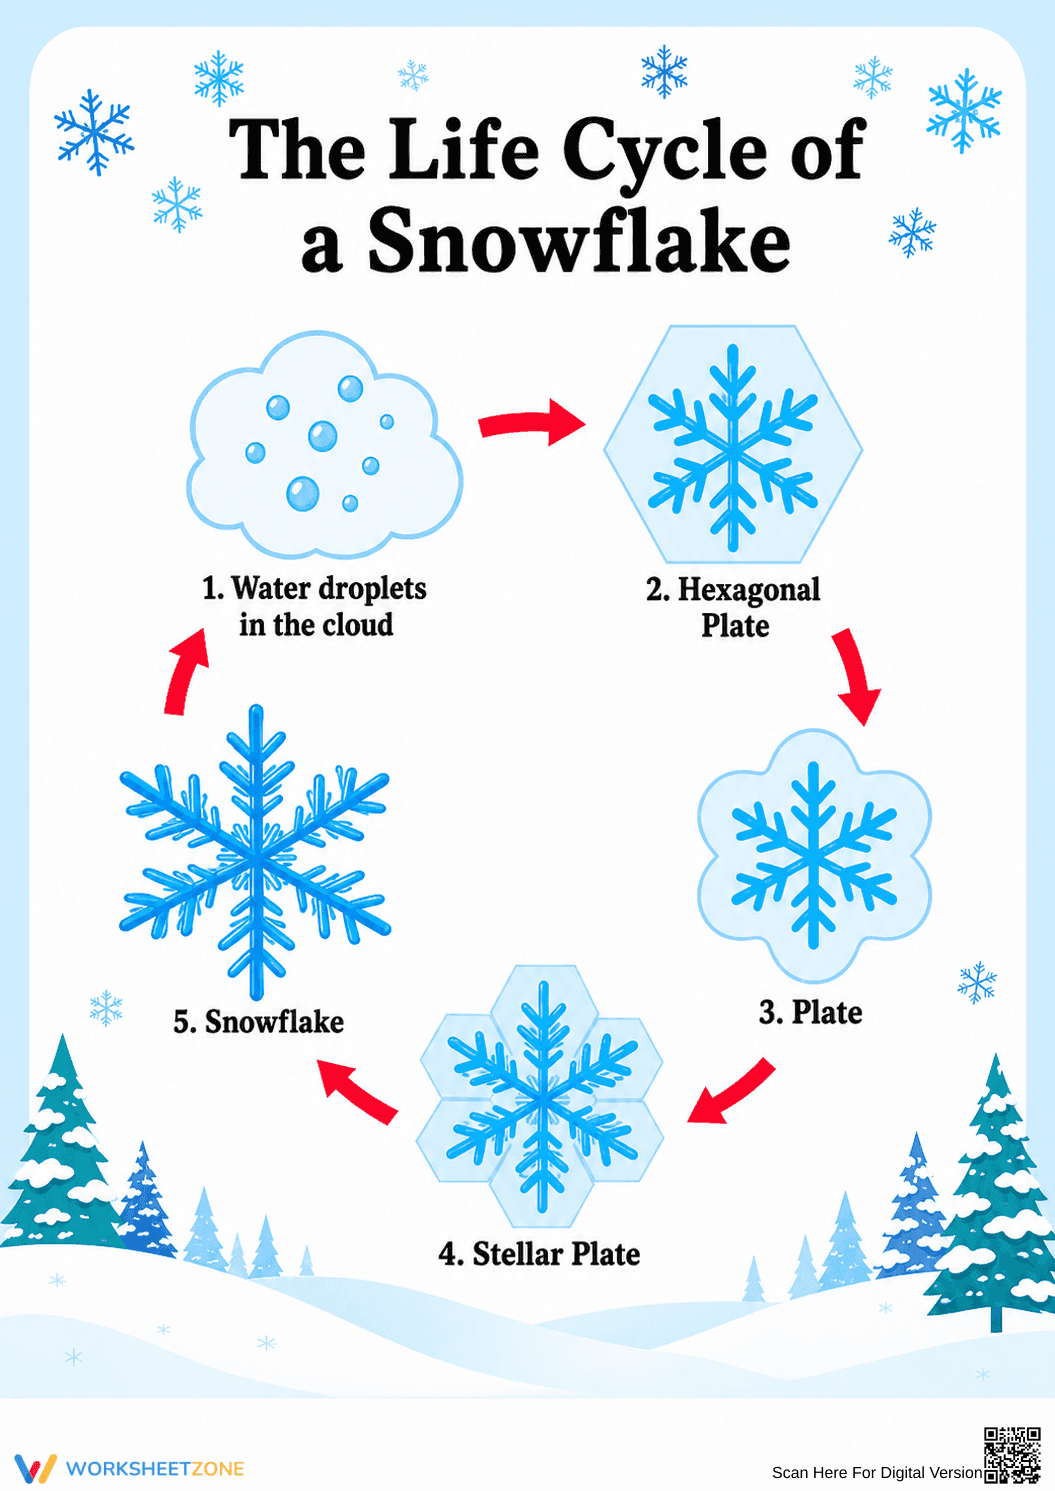

Snowflake Life Cycle Diagram | Essential Grade 2 Science

Paste this activity's link or code into your existing LMS (Google Classroom, Canvas, Teams, Schoology, Moodle, etc.).
Students can open and work on the activity right away, with no student login required.
You'll still be able to track student progress and results from your teacher account.
This Grade 2 science worksheet provides a clear, visual representation of the snowflake life cycle to help students understand how water transforms in the atmosphere. By identifying the 5 distinct stages of formation, learners gain a foundational understanding of meteorology and the physical properties of water in its solid state.
At a Glance
- Grade: 2 · Subject: Science
- Standard:
2-ESS2-3— Obtain information to identify where water is found and its states- Skill Focus: Snowflake formation stages
- Format: 1 page · 5 stages · Visual Diagram · PDF
- Best For: Weather units and winter science lessons
- Time: 10–15 minutes
The resource features a high-contrast circular diagram illustrating the progression from water droplets in a cloud to a fully formed snowflake. It includes 5 numbered stages: water droplets, hexagonal plate, plate, stellar plate, and the final snowflake. The clean layout and bold arrows make it an ideal anchor chart or student reference sheet for any primary science notebook.
Zero-Prep Workflow
- Print: Generate the single-page PDF in seconds.
- Distribute: Hand out to students during a weather unit or winter-themed lesson.
- Review: Spend 5 minutes discussing the transition from liquid droplets to ice crystals.
This resource functions perfectly as a standalone handout or a visual guide for a science notebook entry, requiring less than 2 minutes of total teacher preparation time.
Standards Alignment
This worksheet aligns with `2-ESS2-3`, which requires students to obtain information about where water is found on Earth and that it can exist as a solid or liquid. By tracing the transition from liquid droplets to solid ice crystals, students observe the physical changes inherent in the water cycle. Both standard codes can be copied directly into lesson plans, IEP goals, or district curriculum mapping tools.
How to Use It
Use this diagram as a visual aid during direct instruction about winter weather patterns. After explaining the stages, have students use the worksheet as a reference to draw their own snowflakes, focusing on the hexagonal symmetry mentioned in stage two. It also serves as an excellent formative assessment tool; ask students to explain the "why" behind the arrows to check for understanding of sequential processes. The expected completion time for a guided discussion is 15 minutes.
Who It's For
This resource is designed for second-grade classrooms, but its clear labeling makes it accessible for Grade 3 students exploring more complex weather systems. It is a natural pairing for a read-aloud about "Snowflake" Bentley or a hands-on lab involving ice and water vapor. It is particularly useful for visual learners who benefit from seeing the physical progression of natural phenomena.
The Snowflake Life Cycle Diagram provides a structured visual sequence that supports the acquisition of scientific vocabulary and process-based thinking. Aligned to the 2-ESS2-3 standard, it focuses on the plain-English skill of identifying the states of water and the sequential formation of ice crystals in the atmosphere. Research by Fisher & Frey (2014) emphasizes that visual scaffolds like circular diagrams are critical for helping primary students internalize complex natural cycles and transitions. By providing a clear road map of snowflake development, this worksheet reduces cognitive load and allows students to focus on the relationship between temperature and physical change. This resource is a reliable tool for meeting NGSS requirements while fostering early interest in meteorology and earth sciences through high-quality, accessible instructional design that fits into any winter curriculum.


