


0
Views
0
Downloads
0.0
0
Save
0 Likes
Learn Graphing with Spring Graphing Worksheet
0 Views
0 Downloads
Paste this activity's link or code into your existing LMS (Google Classroom, Canvas, Teams, Schoology, Moodle, etc.).
Students can open and work on the activity right away, with no student login required.
You'll still be able to track student progress and results from your teacher account.
Information
Description
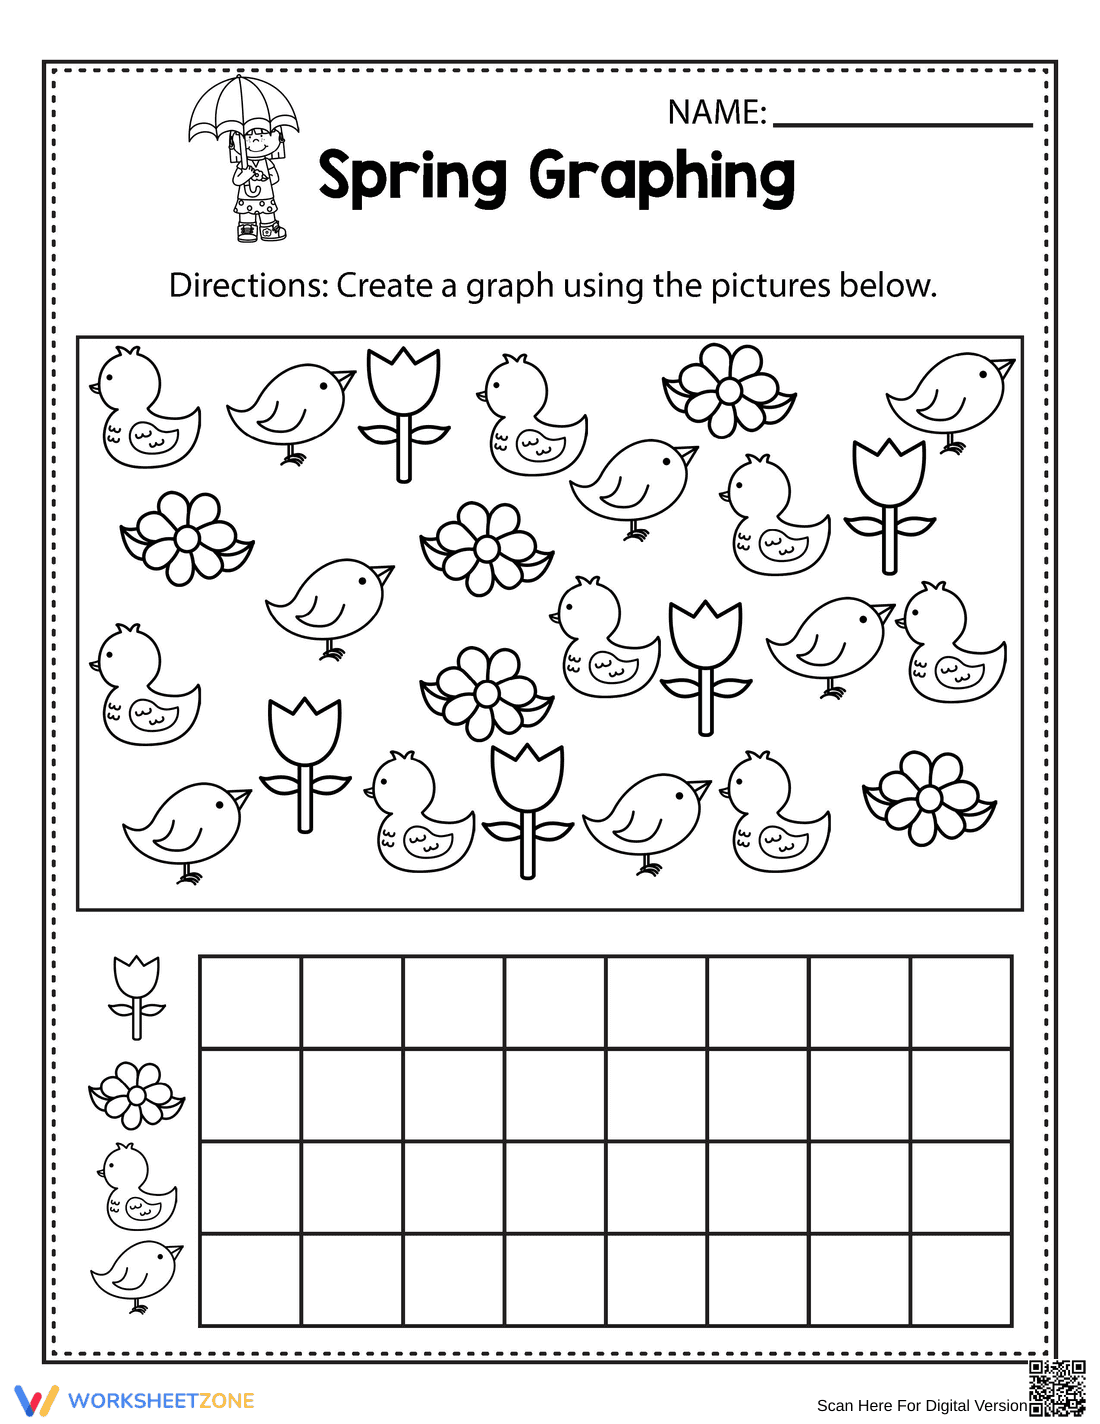
What It Is:
This is a spring-themed graphing worksheet. It features a collection of spring-related images including ducks, birds, flowers, and tulips. Students are instructed to create a graph based on the quantity of each picture provided. The worksheet has a pre-made graph with labels for each picture type.
Grade Level Suitability:
This worksheet is suitable for Kindergarten and 1st Grade. It involves simple counting and graphing skills, appropriate for students learning to represent data visually.
Why Use It:
This worksheet helps students develop their counting, sorting, and graphing skills. It reinforces the concept of data representation and provides a fun, seasonal context for learning. It also helps with visual discrimination.
How to Use It:
First, have the student count the number of each spring image (ducks, birds, flowers, tulips) in the picture. Then, guide them to fill in the graph by coloring or marking the appropriate number of squares for each image.
Target Users:
This worksheet is ideal for kindergarten and first-grade students, homeschoolers, and teachers looking for engaging math activities with a spring theme.