


























Views
Downloads


Printable Ribbon Color Circle Graph Worksheet | Grade 4-6
Paste this activity's link or code into your existing LMS (Google Classroom, Canvas, Teams, Schoology, Moodle, etc.).
Students can open and work on the activity right away, with no student login required.
You'll still be able to track student progress and results from your teacher account.
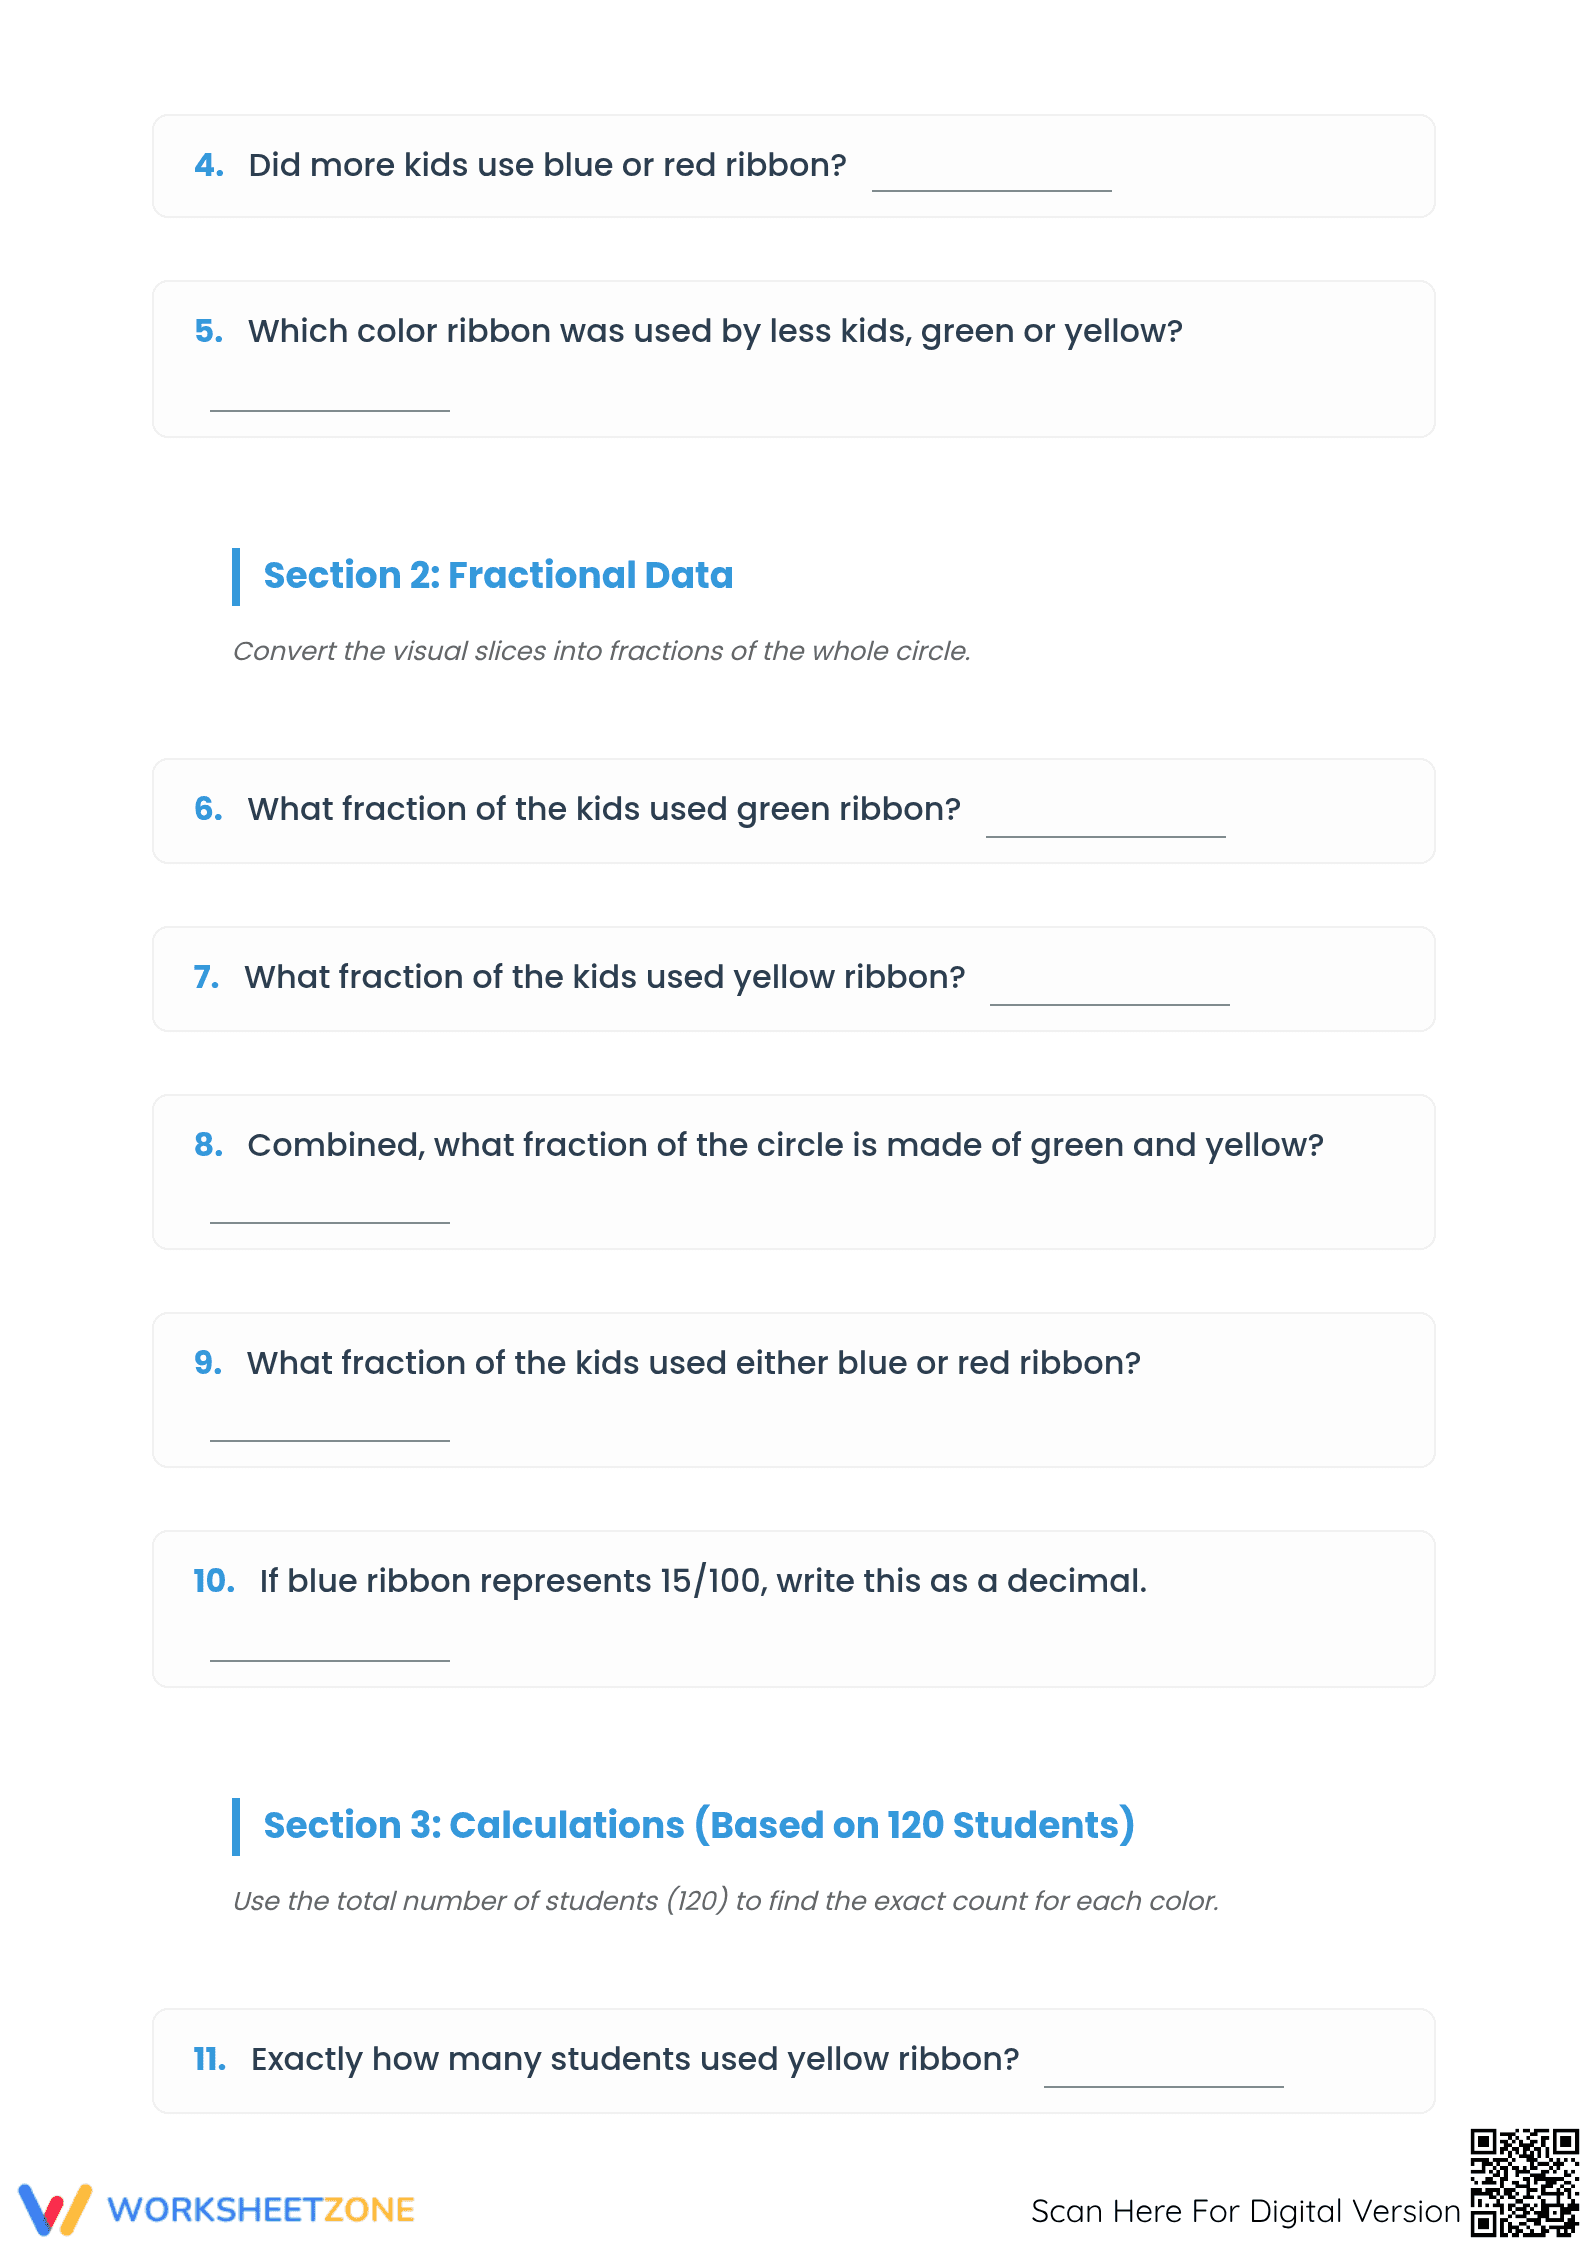
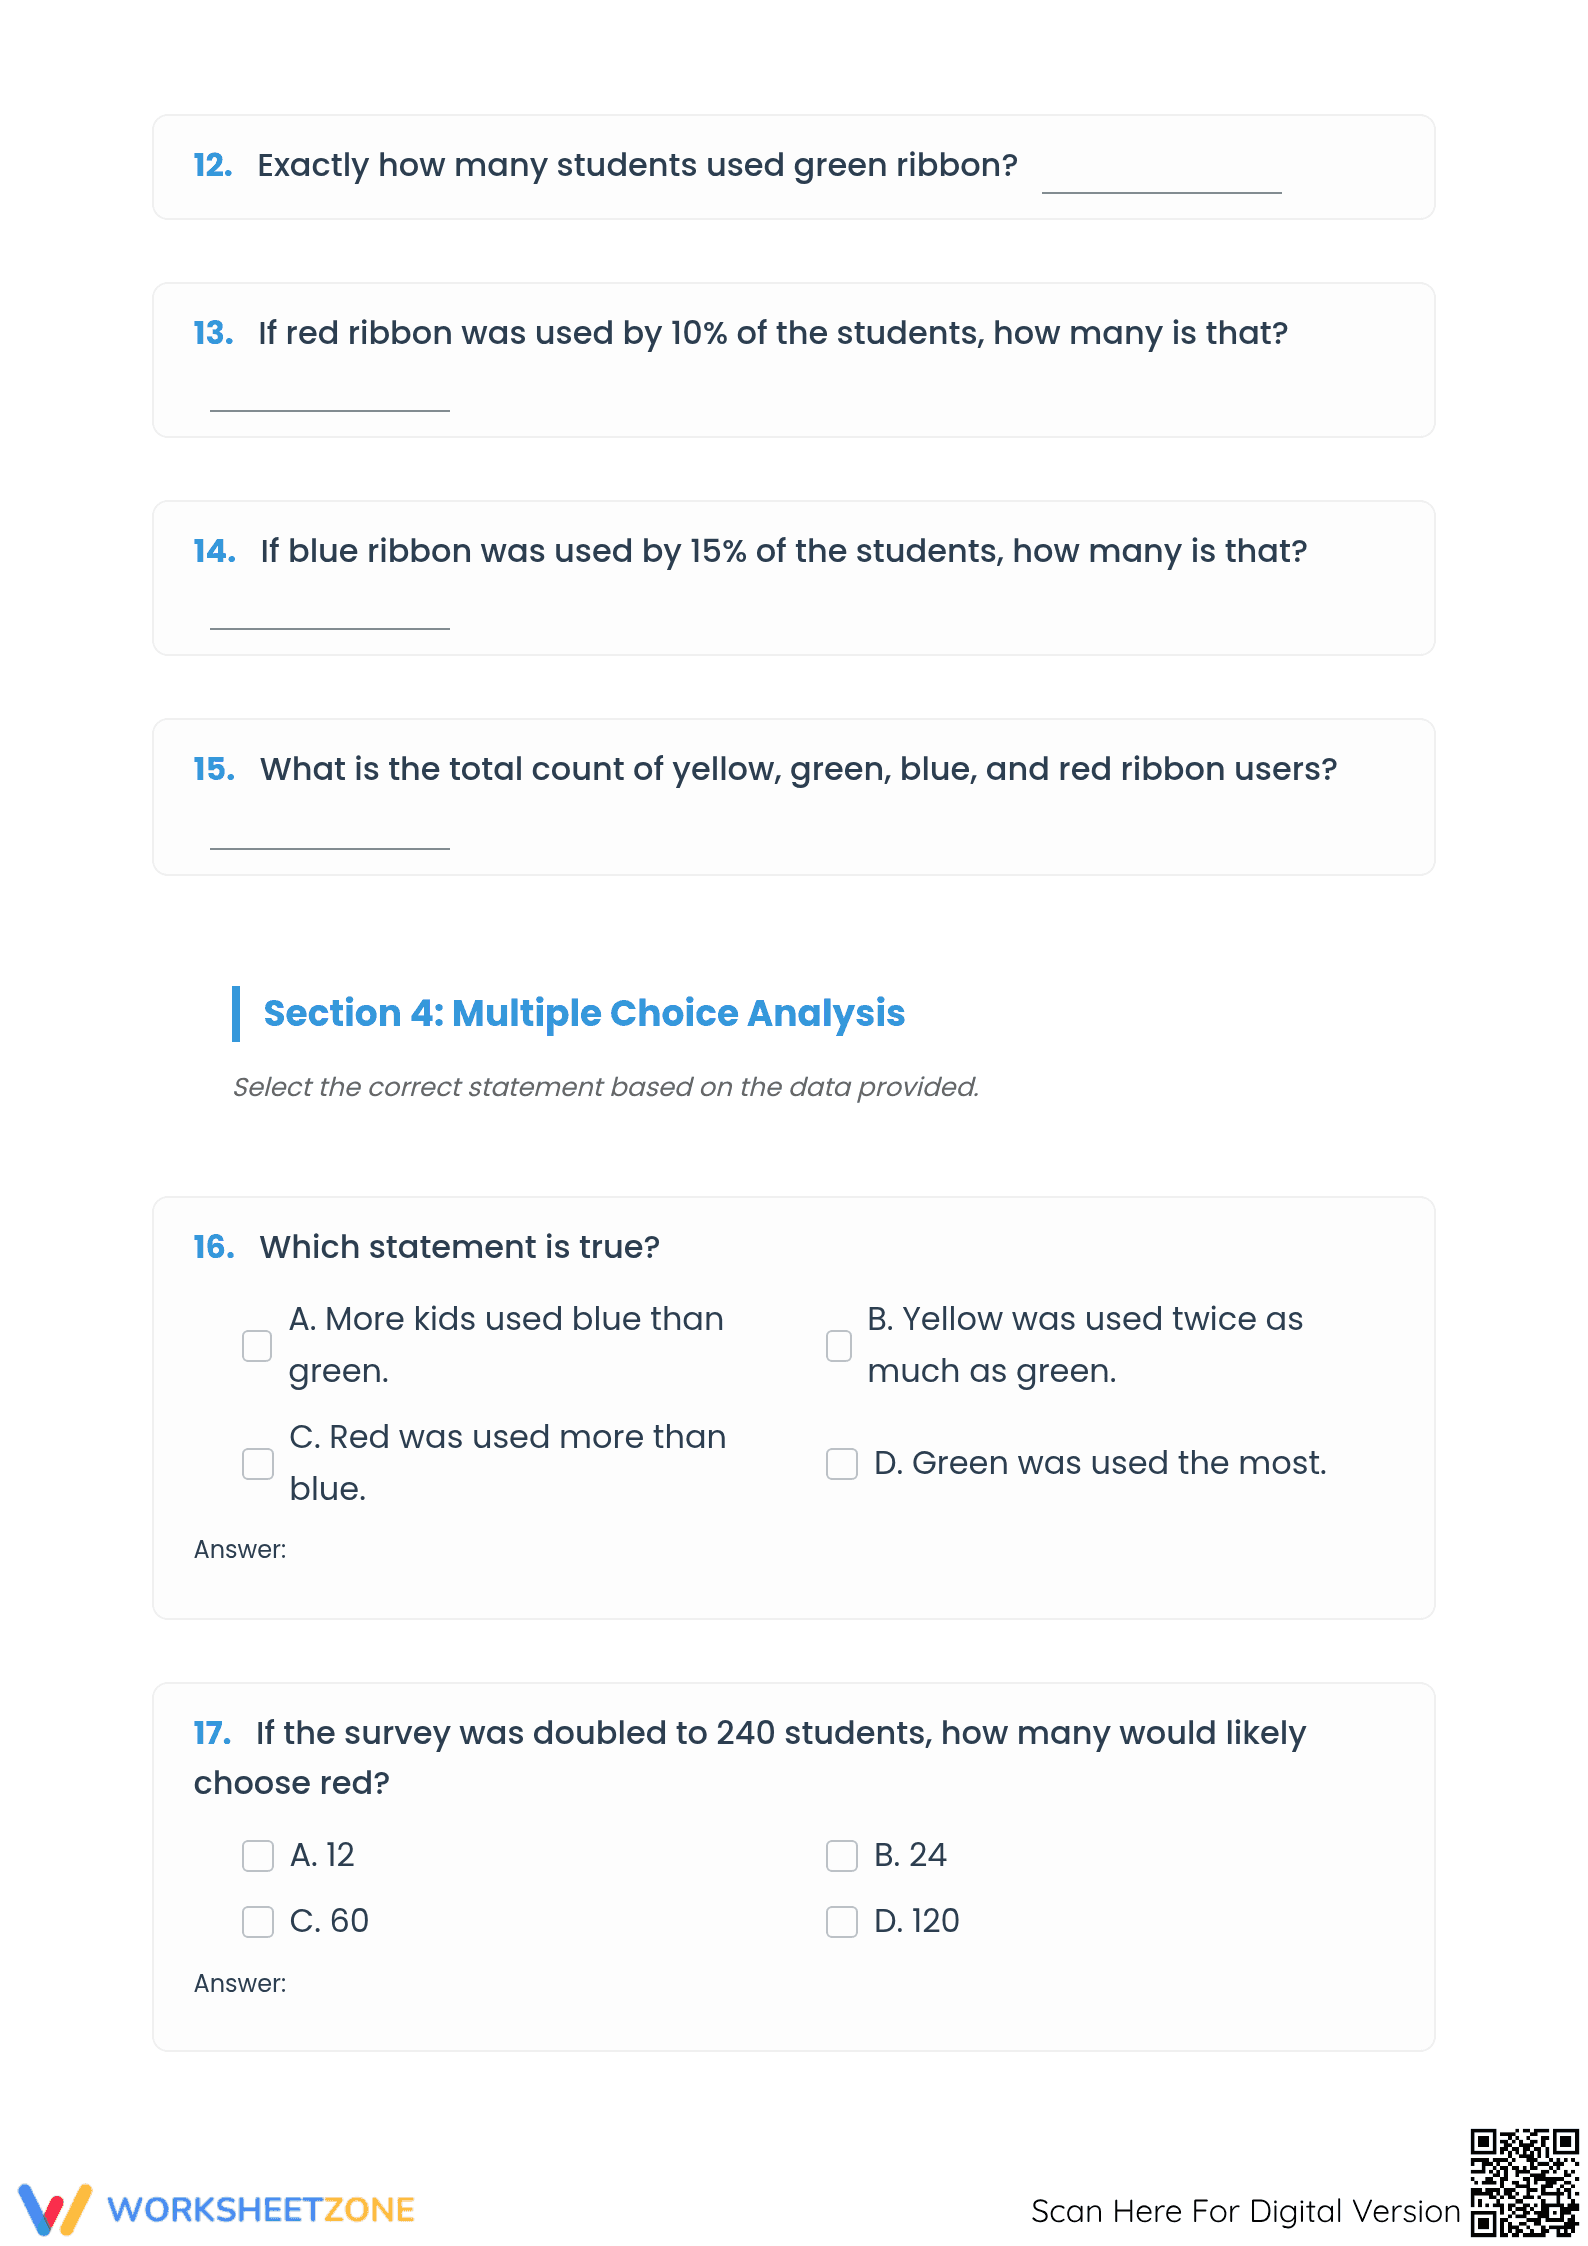
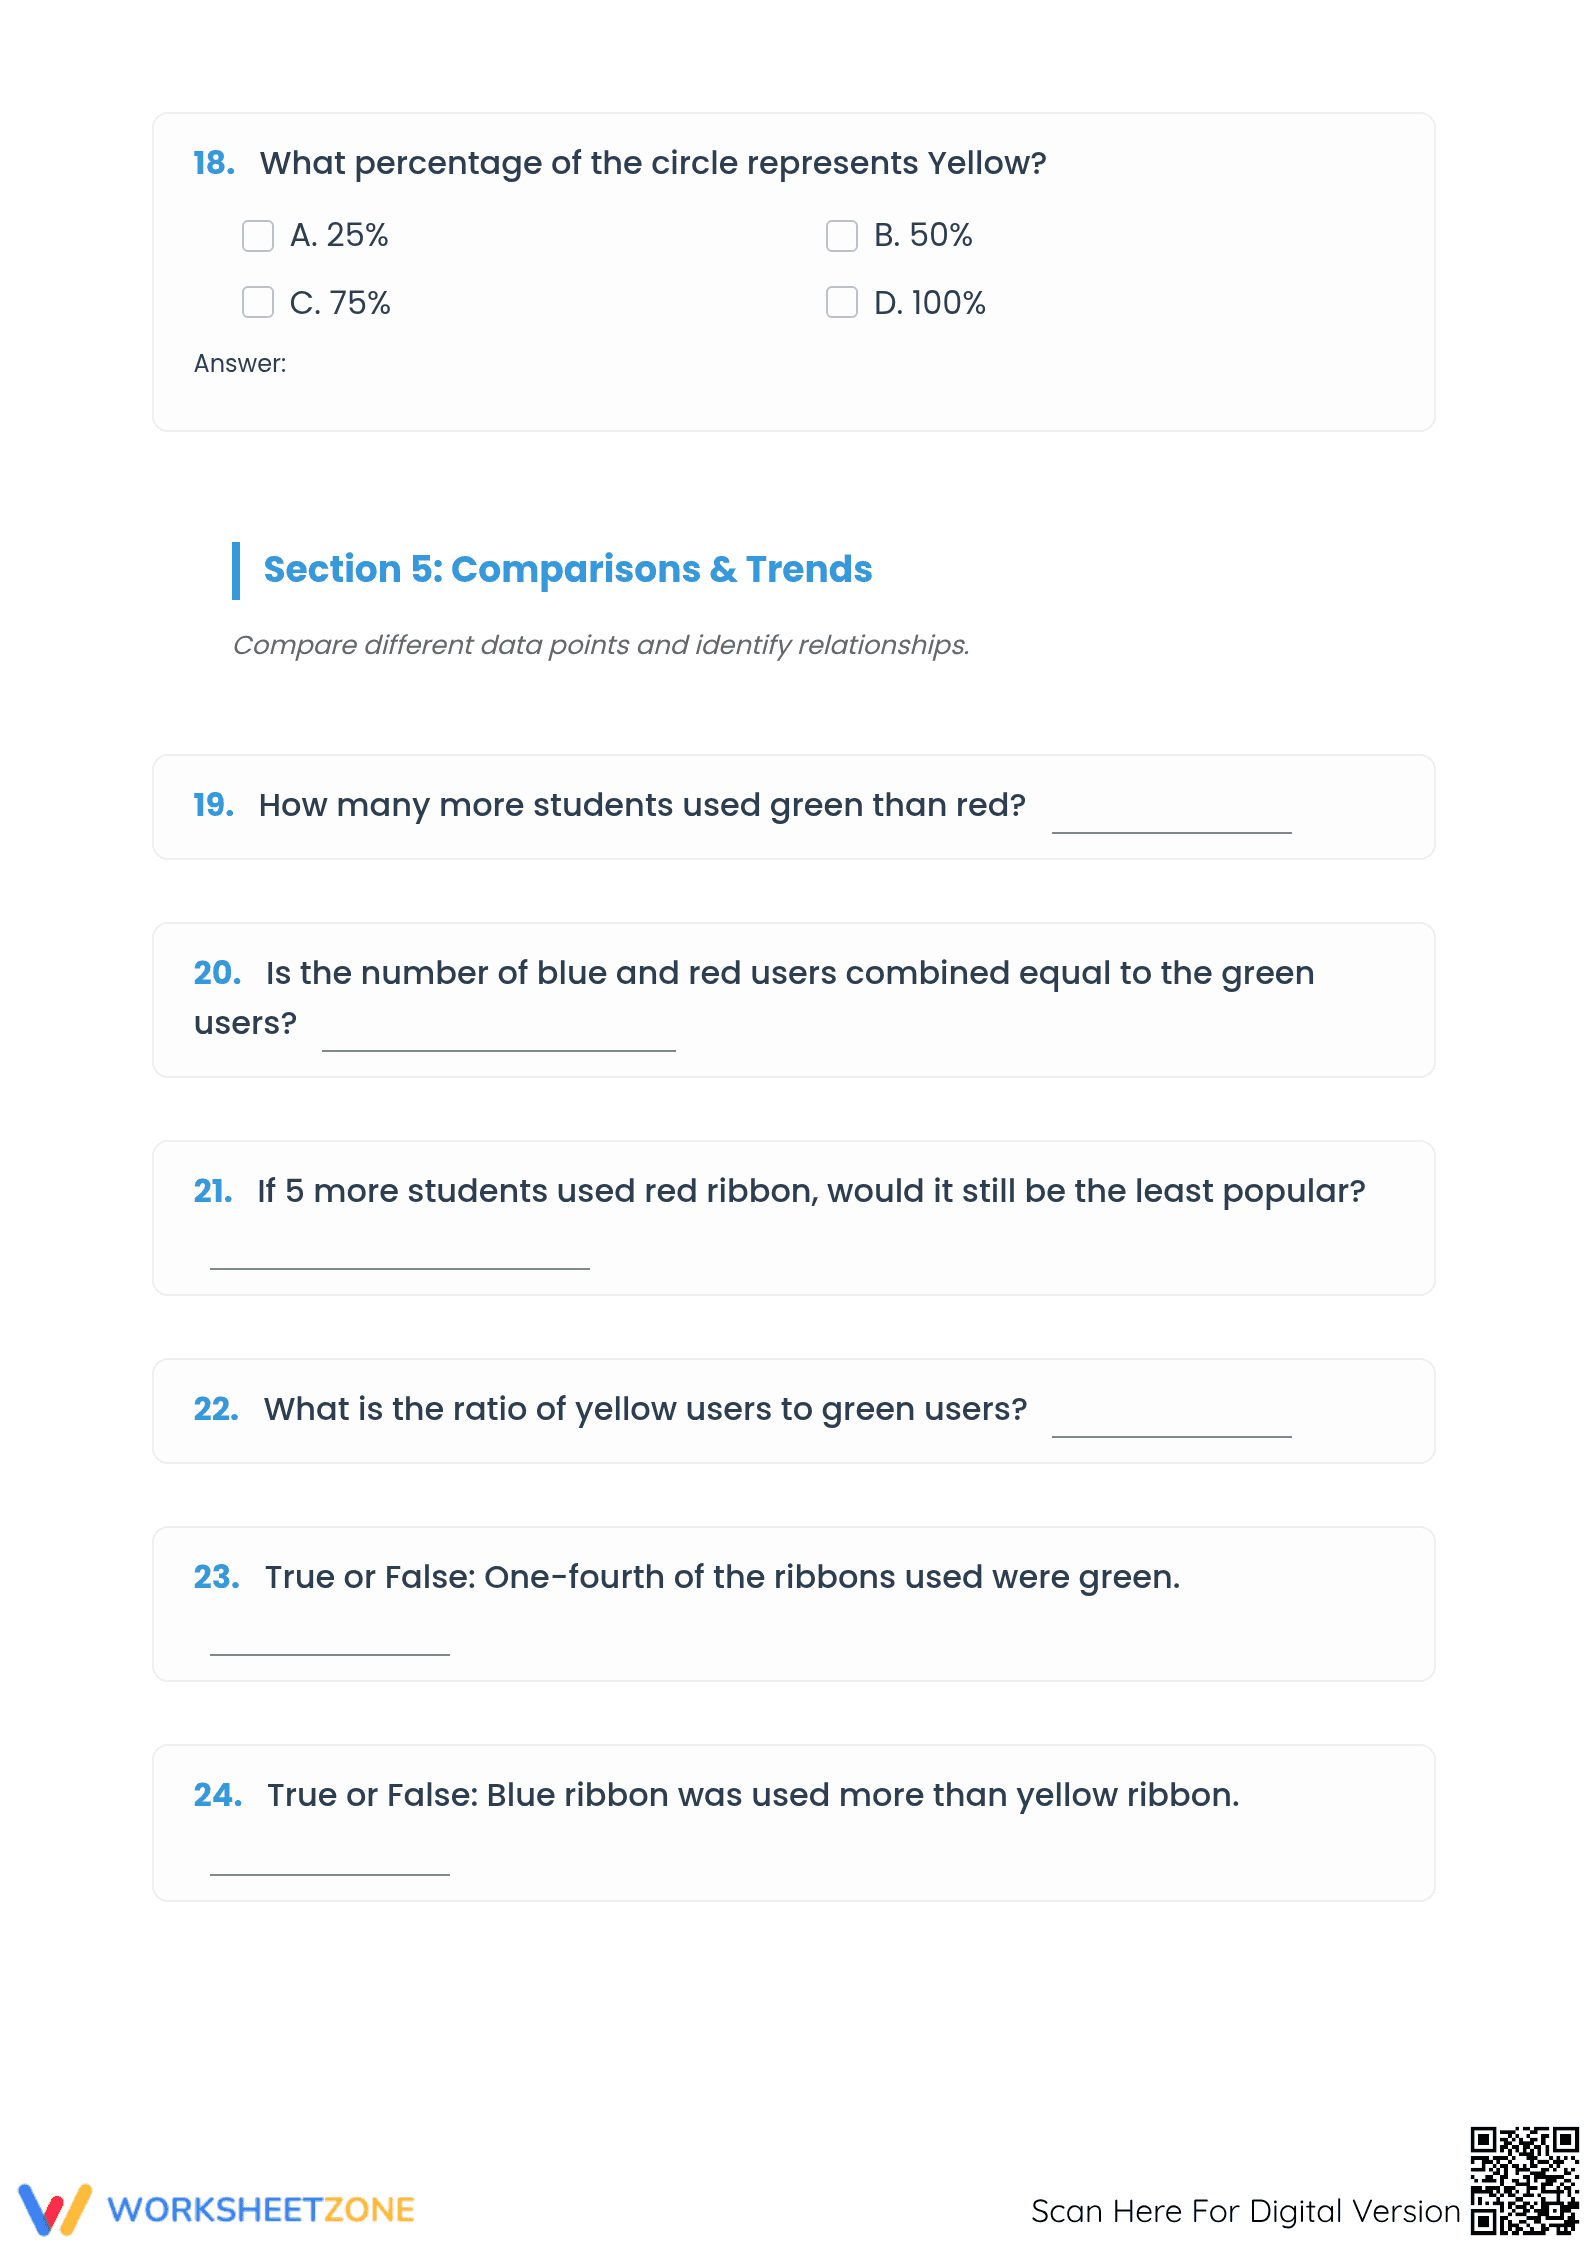
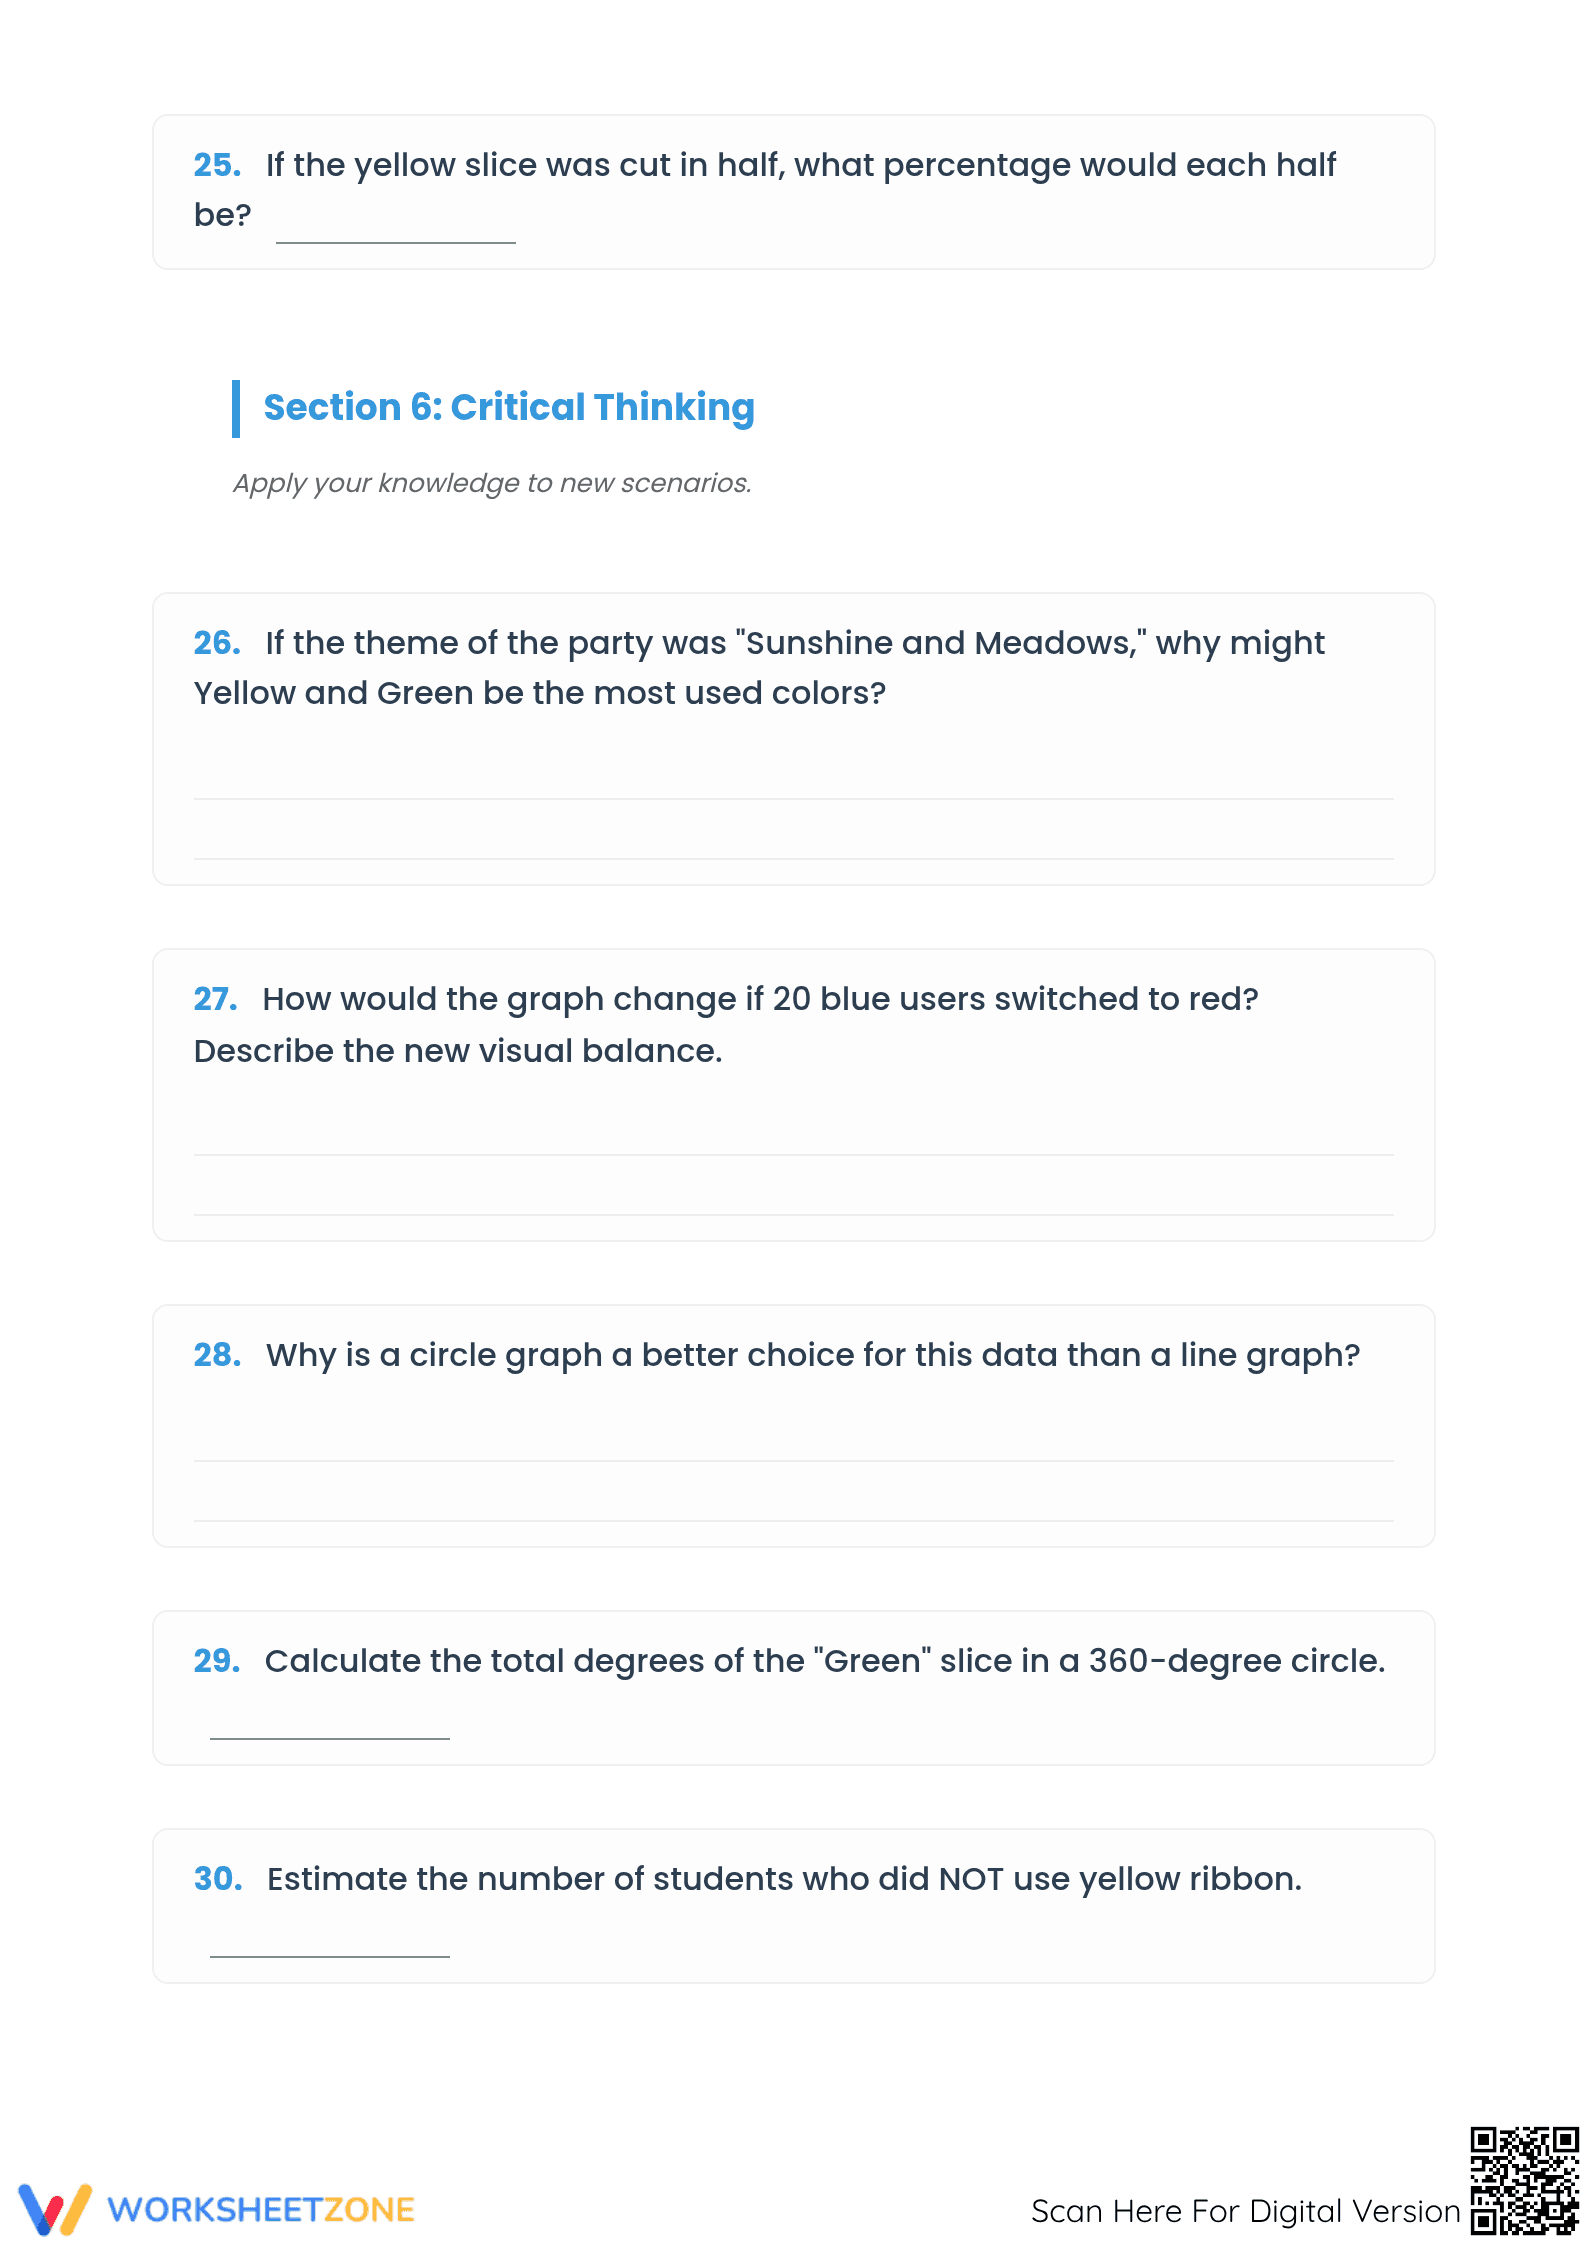
This circle graph worksheet provides Grade 4-6 students with a comprehensive resource for interpreting visual data. By analyzing ribbon color distribution, learners bridge the gap between abstract fractions and concrete representations. This activity ensures students can extract information, perform multi-step calculations, and apply critical thinking to real-world statistical scenarios.
At a Glance
- Grade: 4–6 · Subject: Math
- Standard:
CCSS.MATH.CONTENT.4.MD.B.4— Represent and interpret data by solving problems involving fractional components of a set.- Skill Focus: Circle graph interpretation and analysis
- Format: 5 pages · 30 problems · Answer key included · PDF
- Best For: Independent practice or small group instruction
- Time: 30–45 minutes
The collection features five structured pages containing 30 distinct problems organized into six logical sections. Students move from basic visual identification to complex fractional conversions and population-based calculations. The resource includes a clear visual pie chart, specific sections for decimal conversion, and critical thinking prompts. A complete answer key is provided to facilitate rapid grading and student self-correction during the learning process.
Teachers can implement this resource in three simple steps. First, print the five-page PDF (30 seconds). Second, distribute to students for independent work (30 seconds). Finally, use the included answer key for rapid checking. This streamlined process requires exactly one minute of total teacher preparation, making it a reliable solution for busy classroom schedules or unexpected substitute teacher plans.
The primary standard is `CCSS.MATH.CONTENT.4.MD.B.4`, which focuses on representing and interpreting data sets. Students solve problems involving addition and subtraction of fractions by using information presented in visual formats. The worksheet effectively supports Grade 5 and 6 data standards as well. Both standard codes can be copied directly into lesson plans, IEP goals, or district curriculum mapping tools for administrative tracking.
Assign this worksheet during the independent practice phase of a lesson to verify mastery of data interpretation. It serves as an excellent formative-assessment tool; observe if students struggle with Section 3 calculations. This indicates a need for more support in proportional reasoning. Expect most students to complete the full 30-problem set within a single 45-minute instructional block or as a homework assignment.
This resource is designed for upper elementary students requiring rigorous practice with statistical graphics. It is particularly effective for visual learners who benefit from pie charts. For differentiation, pair this worksheet with a physical fraction circle set or a short data passage. This provides additional context for students who need concrete examples before attempting the abstract calculation and comparison sections.
The "Ribbon Color Circle Graph" worksheet aligns with research emphasizing visual literacy in mathematics. According to RAND AIRS 2024, students who regularly interpret non-linear data sets, such as pie charts, demonstrate higher retention of fractional concepts compared to those using only text-based problems. The 30 tasks provided specifically address the cognitive load required to transition between visual slices and numeric data points. By incorporating multi-step analysis—ranging from simple identification to critical thinking about survey expansion—this resource supports higher-order thinking. The structured layout follows pedagogical frameworks that reduce extraneous cognitive load while maximizing processing. This ensures students focus on mathematical relationships between parts and the whole. The alignment to CCSS.MATH.CONTENT.4.MD.B.4 ensures the content meets national expectations for data proficiency and statistical reasoning in Grade 4-6, providing a proven pathway to data mastery.


