


Views
Downloads
Protein Synthesis Diagram | Grade 9-12 Biology Printable
Paste this activity's link or code into your existing LMS (Google Classroom, Canvas, Teams, Schoology, Moodle, etc.).
Students can open and work on the activity right away, with no student login required.
You'll still be able to track student progress and results from your teacher account.
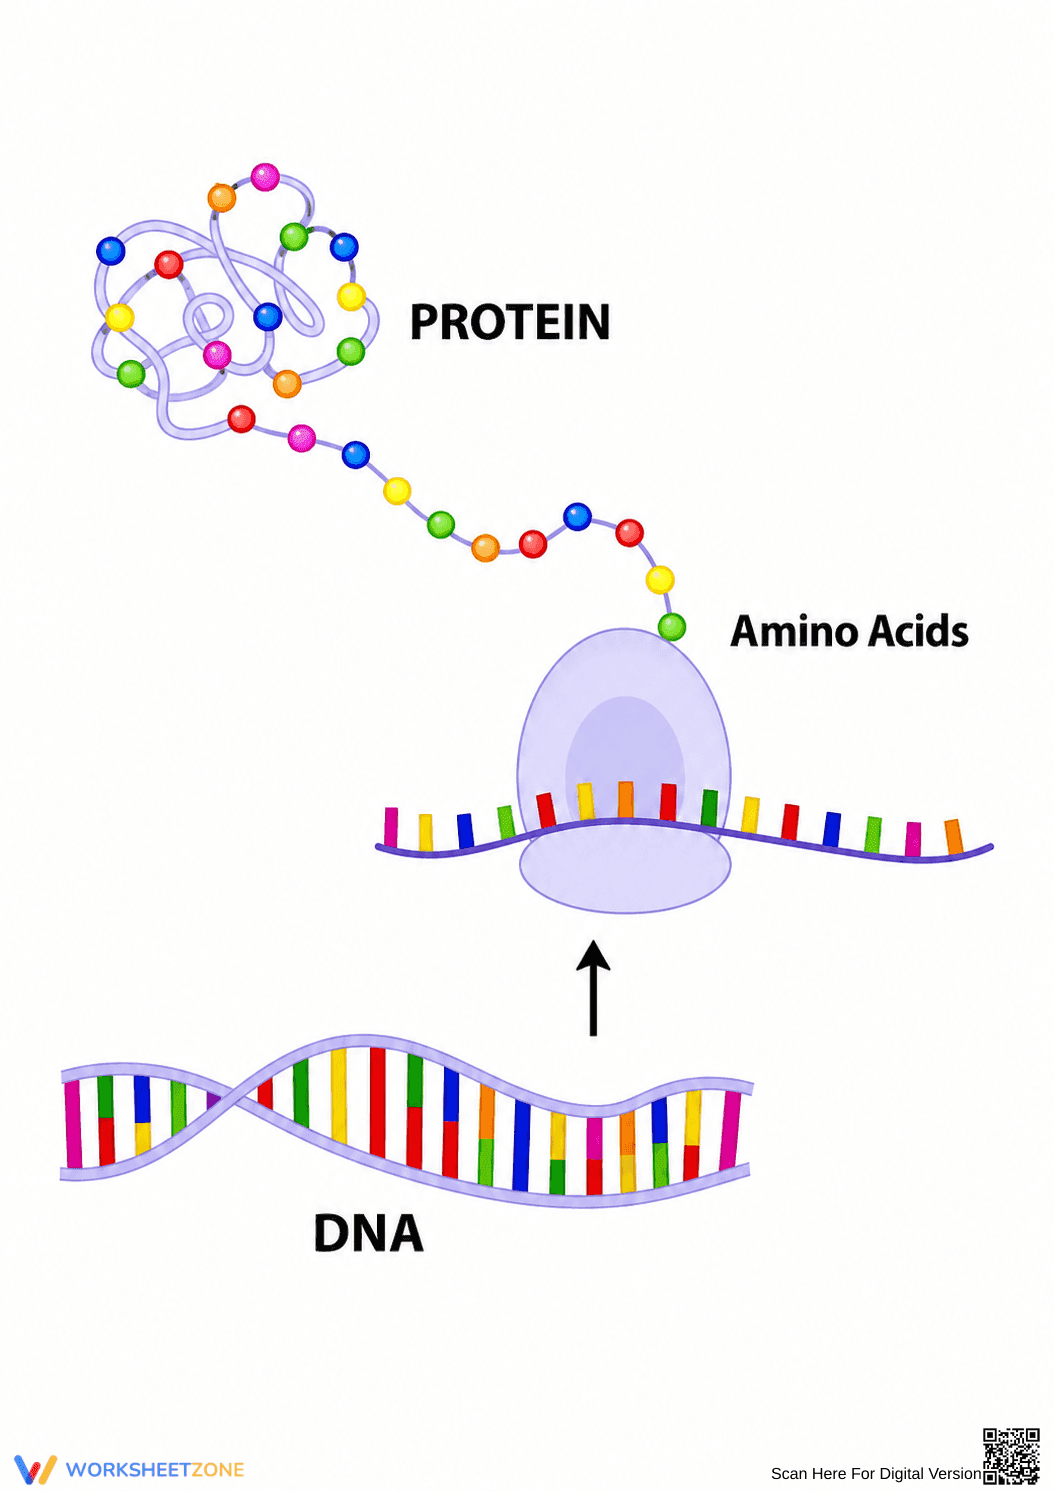
This visual reference diagram helps students understand the fundamental process of protein synthesis by illustrating the journey from DNA to a fully folded protein. By providing a clear, color-coded representation of transcription and translation, this resource allows learners to easily visualize how genetic information is converted into functional amino acid chains.
At a Glance
- Grade: 9–12 · Subject: Biology
- Standard:
HS-LS1-1— Explain how DNA structure determines protein structure- Skill Focus: Visualizing protein synthesis
- Format: 1 page · 0 problems · Reference diagram · PDF
- Best For: Lecture aid and study reference
- Time: 5–10 minutes
Inside this single-page PDF, educators will find a high-quality, full-color diagram detailing the central dogma of molecular biology. The illustration clearly labels the original DNA double helix, the intermediate transcription phase, the resulting chain of amino acids, and the final folded protein structure. Color-coded components help students track how individual building blocks assemble into complex molecules.
This resource is designed for immediate classroom implementation with zero teacher preparation required:
- Print (1 minute): Download and print the PDF or project it directly onto your smartboard.
- Distribute (1 minute): Hand out copies for students to keep in their biology binders.
- Discuss (3 minutes): Use the diagram to guide a class discussion on amino acids.
Total teacher prep time is under two minutes, making this an excellent addition to any genetics unit or emergency sub plan.
This visual aid aligns with HS-LS1-1: Construct an explanation based on evidence for how the structure of DNA determines the structure of proteins which carry out the essential functions of life. Both standard codes can be copied directly into lesson plans, IEP goals, or district curriculum mapping tools.
This diagram is highly versatile. First, it serves as an excellent visual aid during direct instruction; teachers can project the image while explaining transcription and translation. Second, it functions as a valuable study reference for independent practice. As a formative assessment observation tip, ask students to point to specific parts of the diagram and explain what is happening in their own words. Expected review time is 5 to 10 minutes.
This resource is designed for high school biology students in grades 9 through 12. It is particularly beneficial for visual learners who may struggle with dense textbook descriptions of molecular processes. Pair this diagram with a guided notes sheet or a hands-on DNA modeling lab to reinforce the concepts.
Effectively teaching complex molecular processes requires strong visual supports that reduce cognitive load. According to a ScienceDirect TpT Analysis, integrating clear, color-coded diagrams significantly improves student retention of abstract biological concepts in secondary education. This resource directly supports HS-LS1-1 by helping students explain how DNA structure determines protein structure. When learners can visually trace the pathway from a DNA sequence to a chain of amino acids and finally to a folded protein, they build a much more robust mental model of the central dogma of biology. Providing students with high-quality reference materials allows them to focus on understanding the mechanisms of transcription and translation rather than struggling to visualize the microscopic components. This diagram serves as a critical bridge between theoretical genetic codes and the tangible proteins that carry out essential life functions.