































Ready Scatter Plots & Association Worksheet | Grade 8 Math

Paste this activity's link or code into your existing LMS (Google Classroom, Canvas, Teams, Schoology, Moodle, etc.).
Students can open and work on the activity right away, with no student login required.
You'll still be able to track student progress and results from your teacher account.
This comprehensive Grade 8 statistics worksheet equips students to construct, interpret, and model bivariate data using scatter plots. Learners analyze patterns of association, identify clusters and outliers, determine informal lines of fit, and evaluate real-world linear relationships through rigorous mathematical reasoning and contextual interpretation across 16 structured tasks.
At a Glance
- Grade: 8 · Subject: Math
- Standard: Investigate patterns of association in bivariate data and model linear relationships
- Skill Focus: Scatter Plots, Association, Lines of Fit, and Trend Analysis
- Format: 5 pages · 16 problems · Answer key included · PDF
- Best For: Core instruction, targeted remediation, or assessment review
- Time: 45–60 minutes
What's Inside
The 5-page printable resource contains 16 focused problems organized across three scaffolded sections, supplemented by a 2-page detailed answer key. It includes synthetic data tables, coordinate graphs, line-of-fit visual comparisons, and a Core Concepts reference box defining key terminology such as interpolation, extrapolation, and linear slope interpretation.
Skill Progression
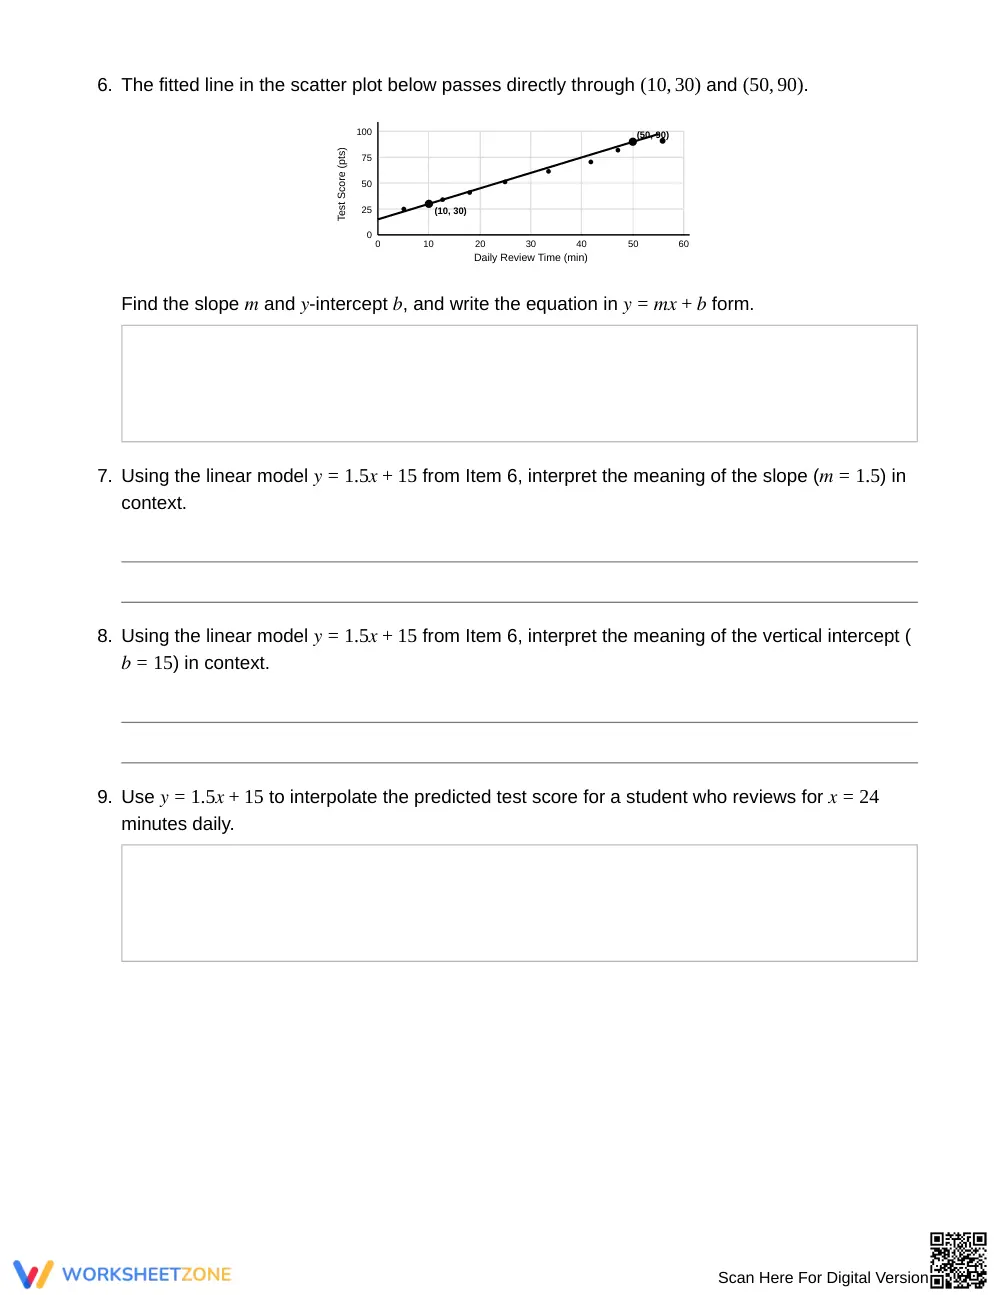
- Guided Practice (Part A, Items 1–4): Builds foundational knowledge through pattern classification, vocabulary application, identifying clusters and outliers from visual graphs, and distinguishing interpolation from extrapolation.
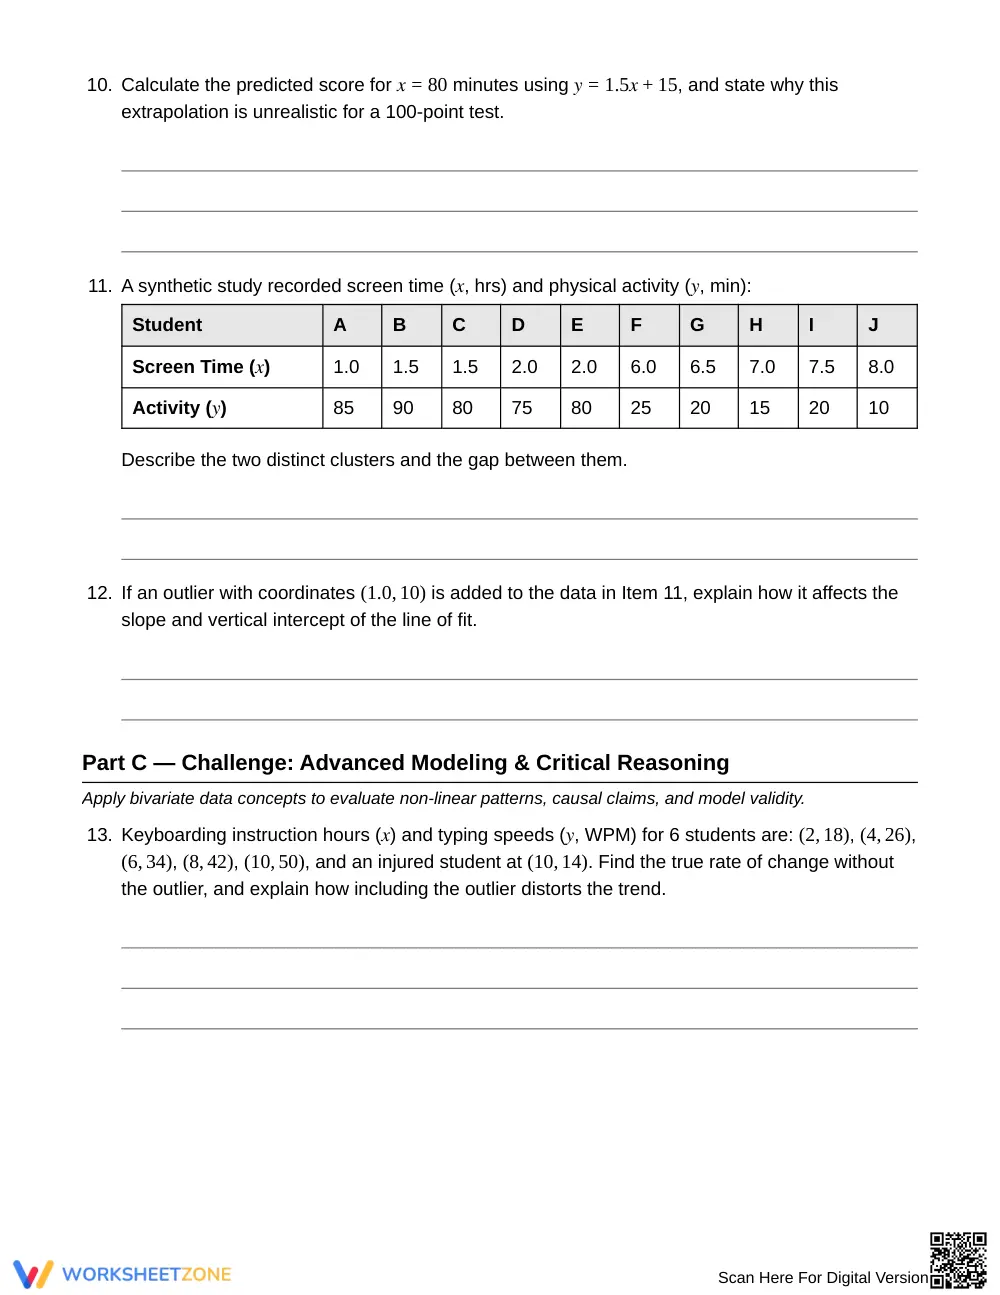
- Supported Practice (Part B, Items 5–12): Guides students through evaluating lines of fit, calculating linear slope and intercept values, writing slope-intercept equations, and predicting values within context.
- Independent Practice (Part C, Items 13–16): Challenges learners to critically analyze outlier distortion, non-linear decay curves, physical domain limitations, and the distinction between correlation and causation.
This structured progression follows an intentional gradual-release framework, moving learners from conceptual recognition to high-level analytical modeling.
Standards Alignment
This worksheet directly aligns with middle school statistics and probability benchmarks for bivariate measurement data. Students construct and interpret scatter plots, describe patterns such as clustering and outliers, fit informal linear trendlines, and use linear equations to solve contextual problems. These competencies can be copied directly into lesson plans, IEP goals, or district curriculum mapping tools.
How to Use It
Deploy this resource during or immediately after direct instruction on linear modeling and bivariate data. In a mid-unit practice session, assign Parts A and B for paired collaboration, using student responses on Item 6 (interpreting slope and intercept) as a formative checkpoint to identify common algebraic misconceptions. For test preparation, assign the complete 16-problem set as an independent review completed within a 45 to 60-minute instructional block.
Who It's For
Designed for Grade 8 mathematics classrooms, this worksheet supports general education students, pre-algebra learners, and students needing targeted intervention in data analysis. Pair this document with an introductory graphing calculator exploration or an anchor chart highlighting linear rate of change.
According to Fisher and Frey (2014), structured guided practice grounded in an intentional gradual-release instructional model significantly enhances student acquisition of complex mathematical modeling skills. This comprehensive 16-problem worksheet operationalizes that empirical research by leading Grade 8 students systematically from basic association recognition to sophisticated bivariate analysis. By confronting non-linear trend curves, calculating rates of change, interpreting intercepts within practical scenarios, and evaluating causal claims, learners develop essential quantitative literacy necessary for advanced algebra and scientific inquiry. Providing explicit visual models alongside independent analytical challenges enables middle school pupils to internalize abstract concepts and transfer statistical reasoning to novel contexts. As students justify their trendline placements and evaluate extreme data points, they build lasting conceptual confidence while reinforcing core middle grades data analysis competencies across diverse problem-solving applications and collaborative classroom discussions.


