




























Views
Downloads



Printable Probability Frequencies Worksheet | Grade 7 Math

Paste this activity's link or code into your existing LMS (Google Classroom, Canvas, Teams, Schoology, Moodle, etc.).
Students can open and work on the activity right away, with no student login required.
You'll still be able to track student progress and results from your teacher account.
This Grade 7 math worksheet develops student mastery in comparing experimental frequencies with theoretical probability models. Learners calculate expected counts across probability experiments, evaluate observed data against theoretical baselines, and articulate reasoned mathematical explanations for discrepancies caused by sample size and chance variation.
At a Glance
- Grade: 7 · Subject: Math
- Standard:
7.SP.C.7— Develop probability models and compare observed frequencies to theoretical predictions- Skill Focus: Compare Experimental and Theoretical Frequencies
- Format: 4 pages · 12 problems · Answer key included · PDF
- Best For: Core instruction, guided practice, formative review
- Time: 45–60 minutes
What's Inside
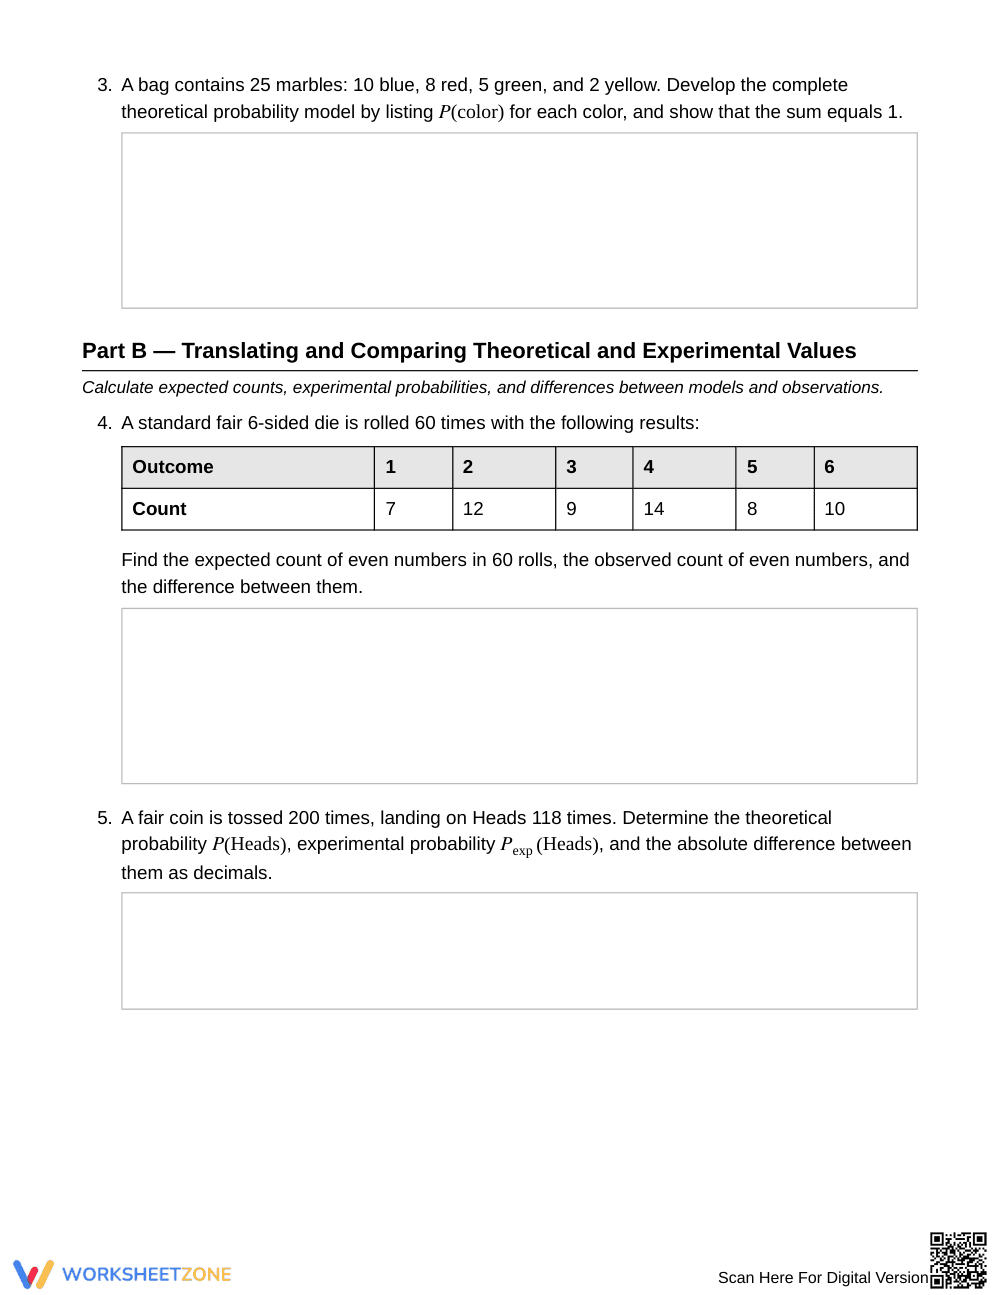
The 4-page PDF includes a 12-problem student practice set and a complete 2-page answer key. A Probability Quick Reference box provides theoretical probability formulas and expected count definitions. Through data tables, students examine 8-sided and 6-sided dice, marble selections, spinner outcomes, and coin tosses.
Skill Progression
- Guided Practice (Part A, 3 tasks): Students identify sample spaces, determine single-event theoretical probabilities, and compute experimental relative frequencies from structured frequency tables.
- Supported Practice (Part B, 6 tasks): Learners calculate expected counts across multiple trials, compare observed counts to models, and evaluate experimental variance across differing sample sizes.
- Independent Practice (Part C, 3 tasks): Students write analytical arguments distinguishing normal chance variation from systemic bias based on trial volume.
This progression leverages the gradual release of responsibility model, guiding learners from calculation routines to conceptual analysis.
Standards Alignment
This activity centers on `7.SP.C.7`, which expects students to develop probability models and evaluate discrepancies between predicted and observed relative frequencies. Supporting standard `7.SP.C.6` guides students to approximate probability by observing frequencies across repeated trials. Both standard codes can be copied directly into lesson plans, IEP goals, or district curriculum mapping tools.
How to Use It
Use this worksheet after direct instruction on probability models. Have students complete Parts A and B in pairs to calculate expected values. Then, assign Part C independently as a formative assessment check; observe whether students recognize that small sample sizes account for discrepancies rather than experimental bias. Typical completion time is 45 to 60 minutes.
Who It's For
Designed for Grade 7 math classrooms, math intervention groups, and resource settings. Provide calculators for multi-digit calculations as needed, or offer visual fraction bars. Pair this resource with hands-on coin or spinner simulation activities to reinforce theoretical versus experimental concepts.
Grounding Grade 7 mathematics in empirical data allows students to connect theoretical probability with observable outcomes. Standard 7.SP.C.7 requires middle school learners to develop probability models and systematically compare observed frequencies against theoretical predictions. According to Fisher & Frey (2014), structured instructional sequences that guide students from initial definitions through computational application to independent explanations yield significant gains in conceptual retention and procedural fluency. This 12-task worksheet puts that instructional framework into practice by pairing scaffolded reference formulas with concrete trial data from spinners, dice, and coin experiments. By moving from straightforward fraction calculations to written critiques of sample size effects, learners build the ability to distinguish random variation from statistical bias. Consequently, teachers receive actionable diagnostic information while students master core probability concepts essential for subsequent high school probability and data literacy.


