

































Printable Influential Points Worksheet | Grade 12 Statistics

Paste this activity's link or code into your existing LMS (Google Classroom, Canvas, Teams, Schoology, Moodle, etc.).
Students can open and work on the activity right away, with no student login required.
You'll still be able to track student progress and results from your teacher account.
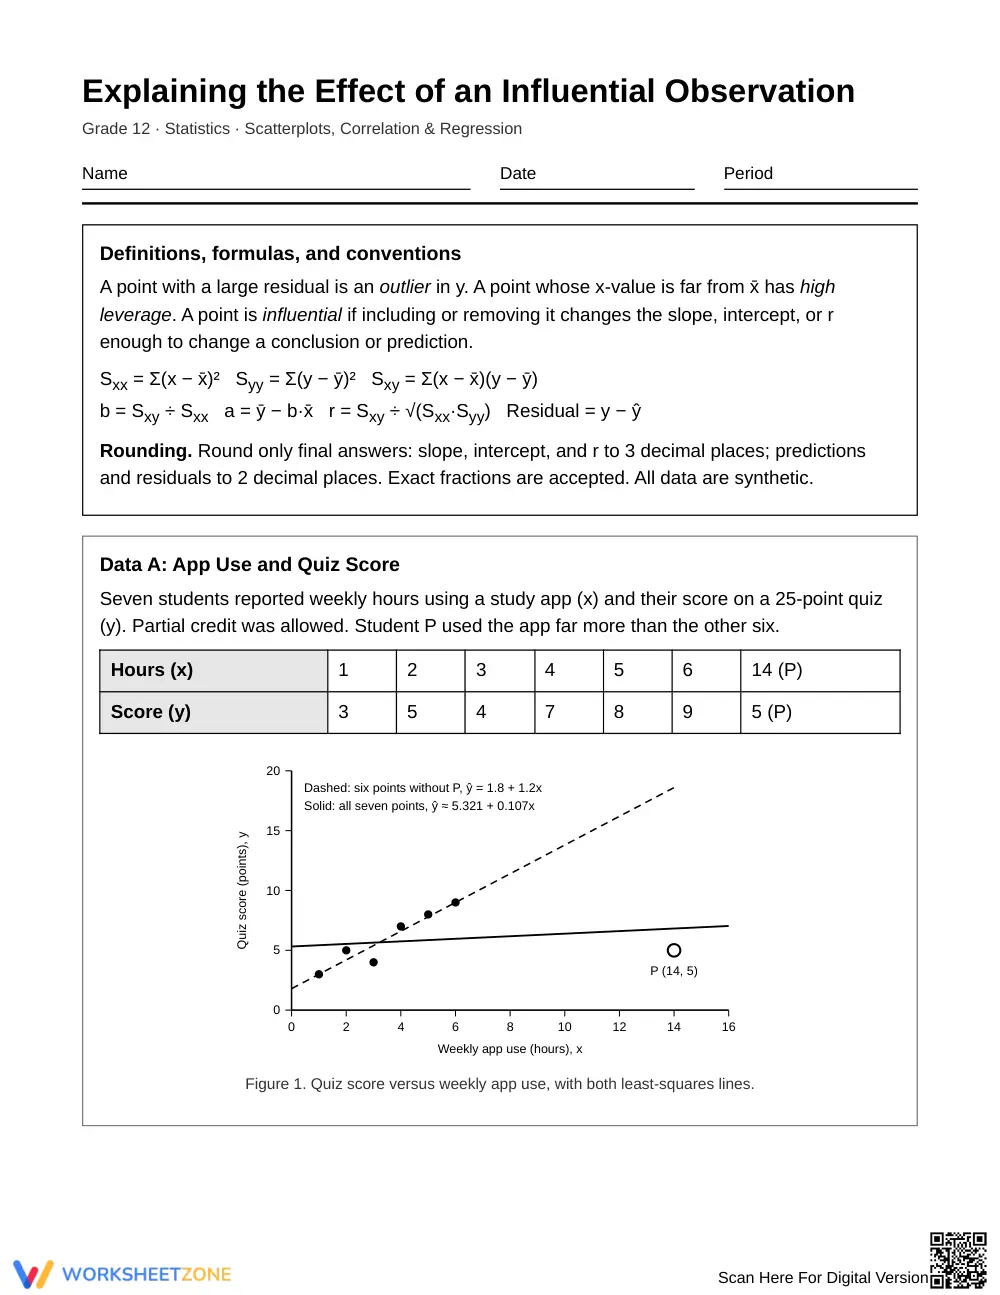
This worksheet teaches Grade 12 Statistics students to explain how a single high-leverage point changes a least-squares line. Students compute slope, intercept, and r with and without the point, then use leverage and residuals to justify why a prediction or conclusion shifts.
At a Glance
- Grade: 12 · Subject: Statistics
- Standard:
HSS-ID.B.6— Compare lines fitted with and without one point, then explain the change- Skill Focus: Explaining the effect of an influential observation
- Format: 6 pages · 6 problems · Answer key included · PDF
- Best For: Late-unit regression practice and review
- Time: 45–60 minutes
What's Inside
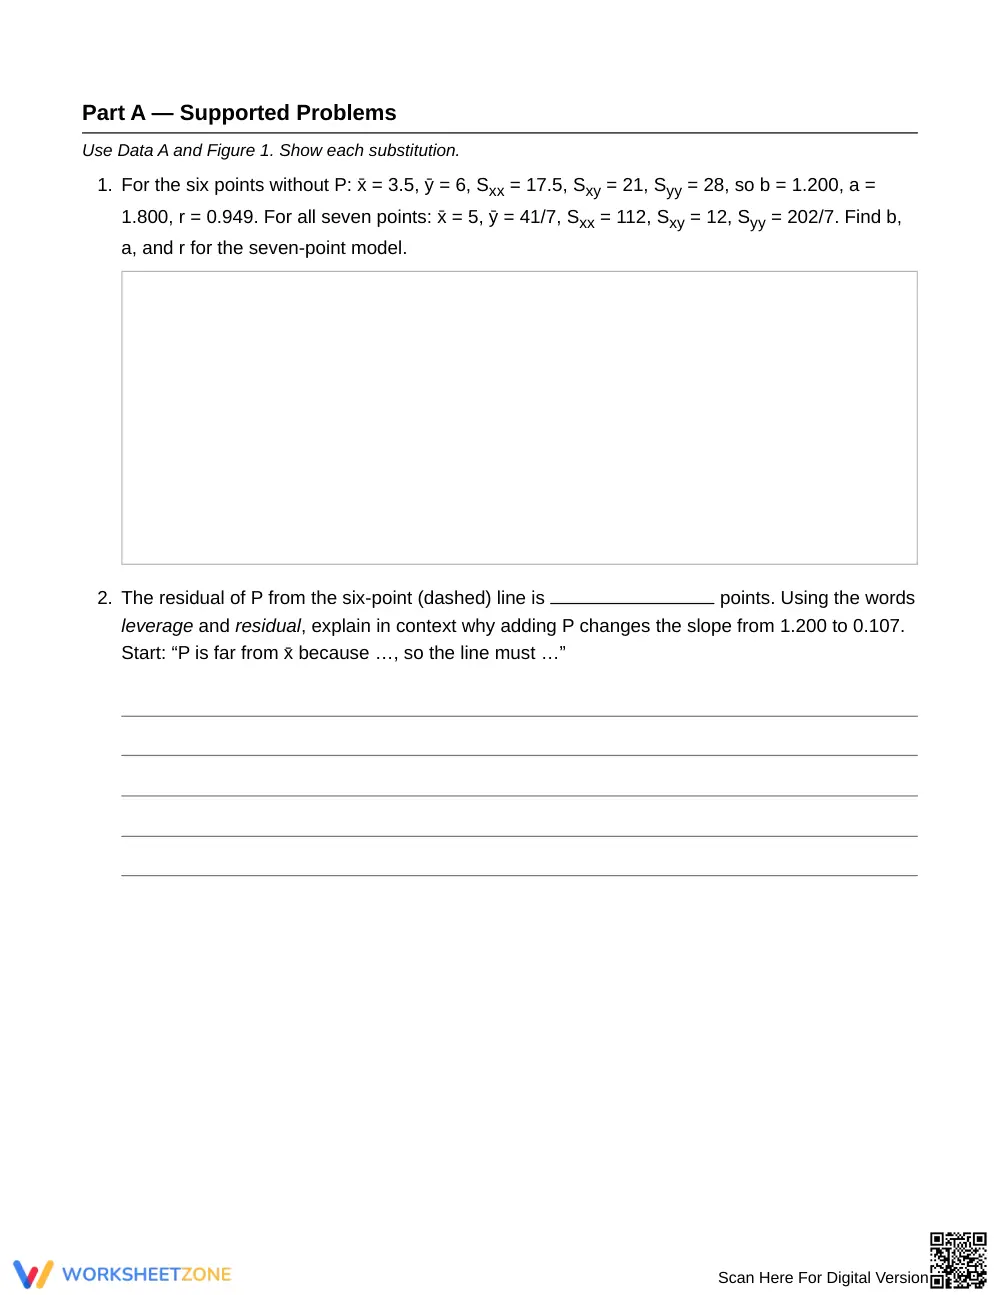
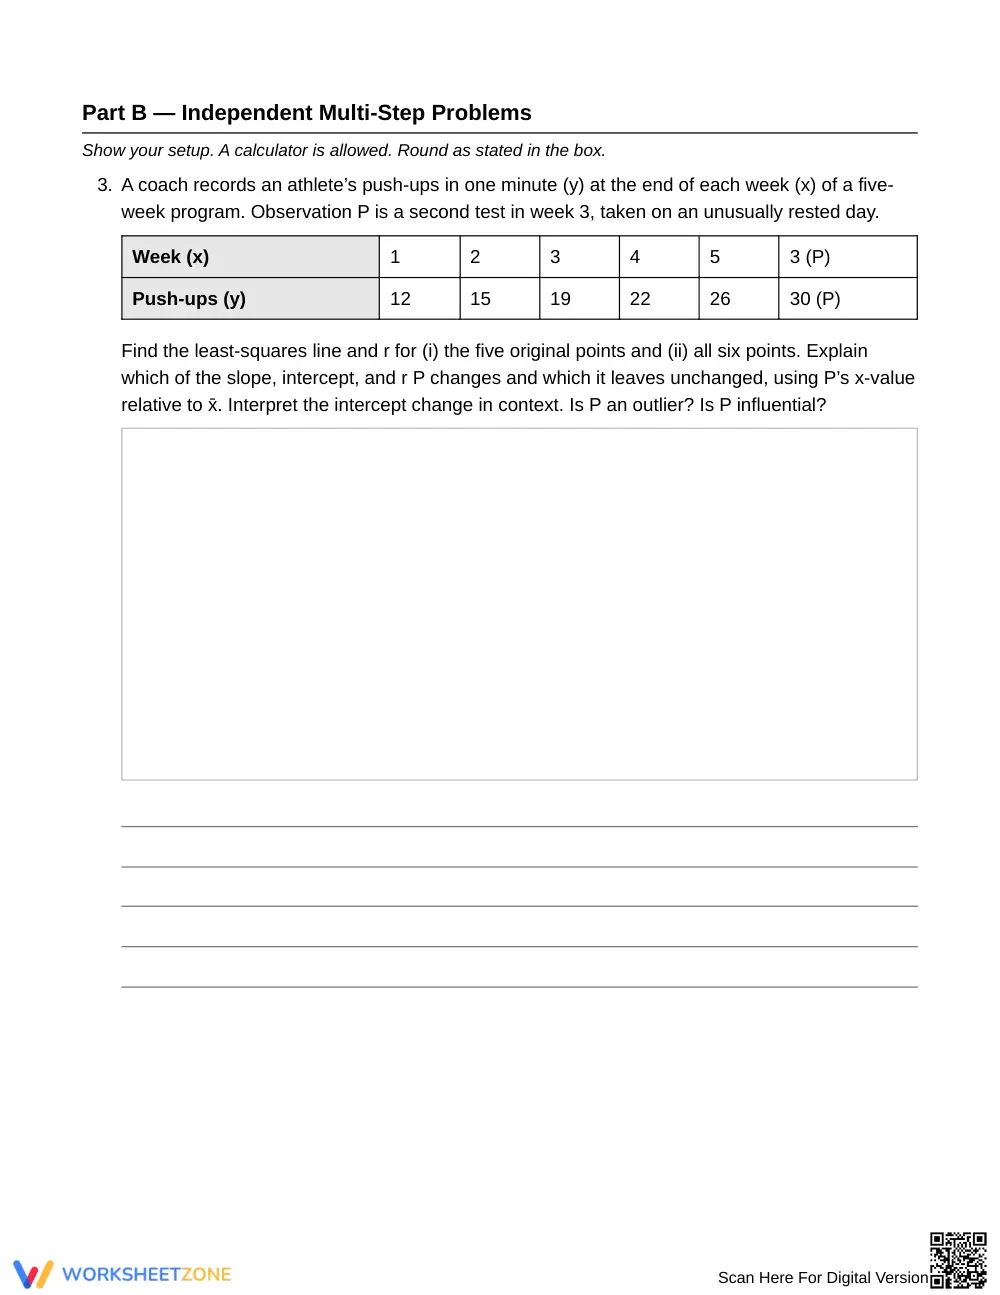
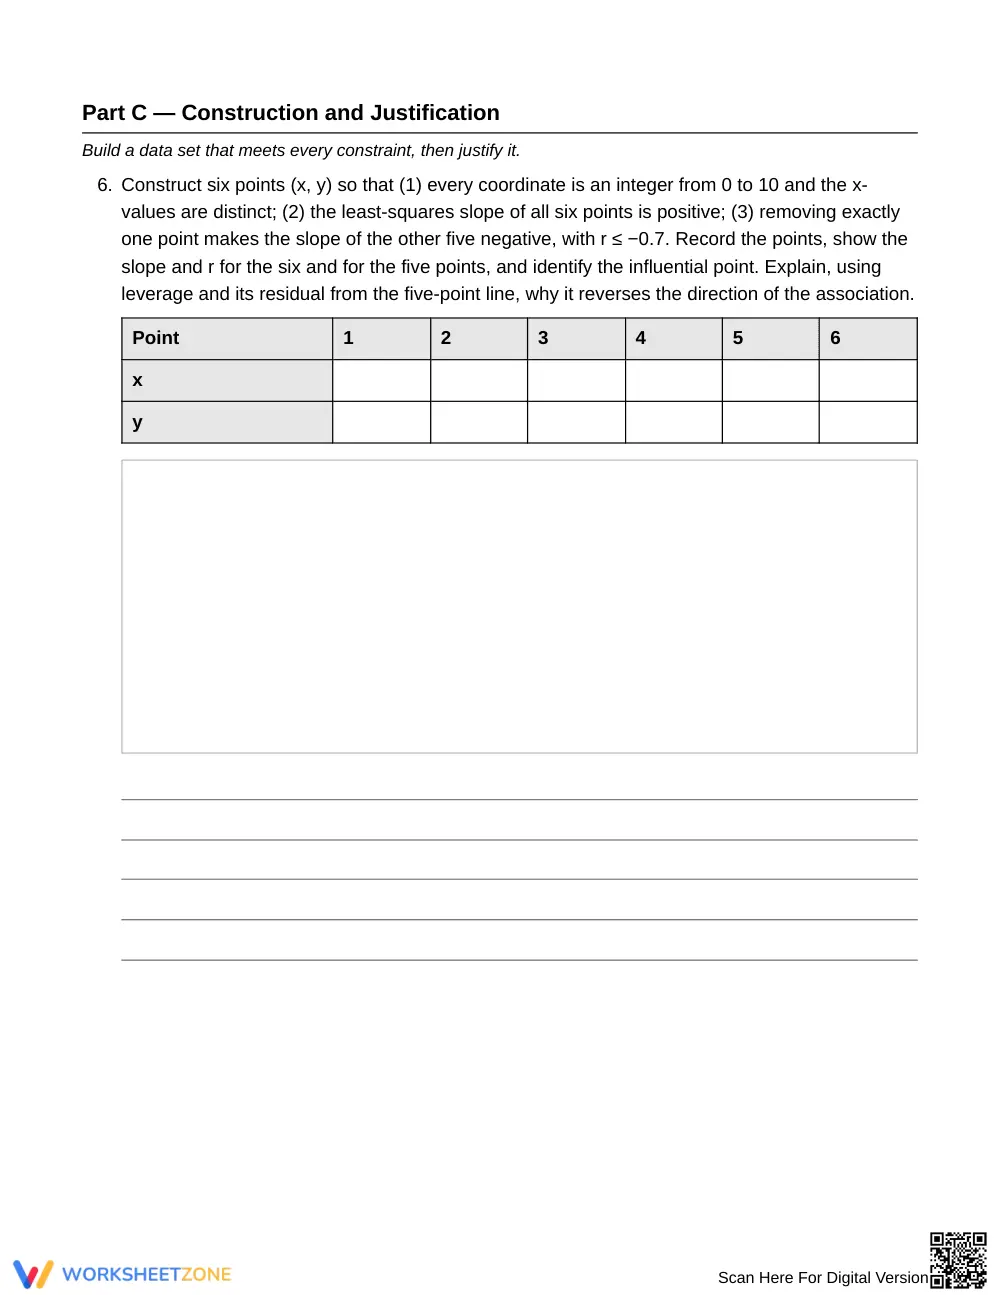
The worksheet has 6 tasks in three parts: two supported problems on a shared app-use data set with a scatterplot showing both regression lines, three multi-step problems (push-ups, an unknown-y problem, advertising and sales), and one construction task. A definitions box lists formulas and rounding rules. A 4-page answer key is included.
Skill Progression
- Guided practice: 2 problems give the six-point statistics and a sentence starter.
- Supported practice: 3 multi-step problems keep the formula box and rounding rules in view.
- Independent practice: 1 task asks students to build and justify a data set from constraints.
The sequence follows gradual release (I Do, We Do, You Do), moving from given statistics to open construction.
Standards Alignment
HSS-ID.B.6 — Represent data on two quantitative variables on a scatter plot and describe how the variables are related, including fitting a linear function and assessing fit with residuals. This standard code can be copied directly into lesson plans, IEP goals, or district curriculum mapping tools.
How to Use It
- During instruction: assign Part A in pairs after teaching residuals and leverage, about 15 minutes.
- After instruction: assign Parts B and C as review or homework.
Formative tip: listen for students who justify influence by x relative to x̄ (leverage) rather than residual size alone. Expect 45–60 minutes total.
Who It's For
Built for Grade 12 Statistics students, including AP-style and college-prep courses, who already compute least-squares lines. Part A's given statistics support students still building fluency; Part C works as an extension. Pair it with an anchor chart separating outlier, leverage, and influence.
The Grade 12 Statistics worksheet “Explaining the Effect of an Influential Observation” addresses HSS-ID.B.6: students fit a linear model to two-variable data, use residuals to judge fit, and explain in context how one point changes the slope, intercept, and correlation. Six tasks move from supported computation with given summary statistics to multi-step comparisons of lines fitted with and without a high-leverage point, and finally to constructing a data set in which one point reverses the direction of association. Students must distinguish an outlier in y from a high-leverage point and from an influential point, then justify each claim with numbers. This structure reflects the gradual release model described by Fisher & Frey (2014), in which teacher modeling gives way to guided and then independent work. The resource includes a 4-page answer key and fits a 45–60 minute class period.


