




























Views
Downloads


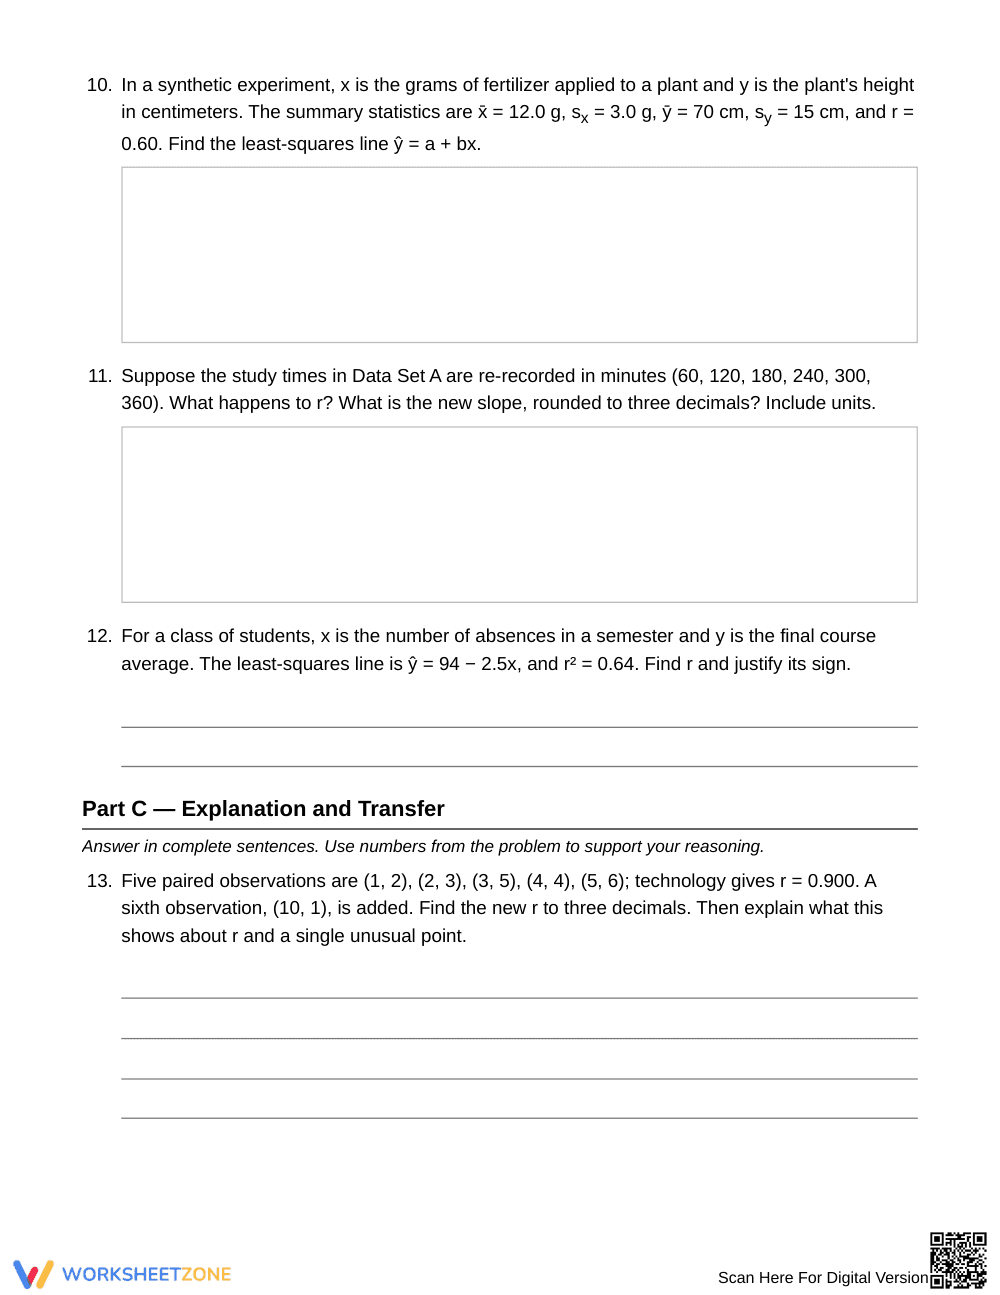


Printable Correlation & r² Worksheet | Grade 12 Statistics

Paste this activity's link or code into your existing LMS (Google Classroom, Canvas, Teams, Schoology, Moodle, etc.).
Students can open and work on the activity right away, with no student login required.
You'll still be able to track student progress and results from your teacher account.
This worksheet helps Grade 12 Statistics students interpret the correlation coefficient, least-squares slope, intercept, and r² in context. Students move from concept distinctions to calculator-based applications and written critiques, so they can explain what each statistic means, and what it does not mean.
At a Glance
- Grade: 12 · Subject: Statistics
- Standard:
HSS-ID.C.8— Compute r with technology and interpret correlation and regression in context- Skill Focus: Correlation and least-squares meaning
- Format: 5 pages · 16 problems · Answer key included · PDF
- Best For: Unit review after regression instruction
- Time: 45–60 minutes
What's Inside
Part A has four multiple-choice concept items. Part B has eight short applications built on a six-student study-time data set plus summary-statistics problems. Part C has four written explanation items on outliers, extrapolation, causation, and regression direction. A Key Ideas box with rounding conventions sits at the top of page 1, and an answer key is included.
Skill Progression
- Guided practice: 4 multiple-choice items in Part A, with the Key Ideas box as a reference.
- Supported practice: 8 short applications in Part B, using technology, a shared data set, and given setup space.
- Independent practice: 4 written explanations in Part C, with no scaffold beyond the numbers in each problem.
The sequence follows gradual release: I Do, We Do, You Do.
Standards Alignment
HSS-ID.C.8 — Compute (using technology) and interpret the correlation coefficient of a linear fit. Supporting standard HSS-ID.C.9 is addressed in the lurking-variable critique, where students distinguish correlation from causation. Both standard codes can be copied directly into lesson plans, IEP goals, or district curriculum mapping tools.
How to Use It
Assign Part A right after direct instruction as a quick check, then use Parts B and C as guided classroom work or homework. While students work, watch whether they attach units to the slope and describe r as a statement about linear association, not causation. Expect 45–60 minutes for the full set.
Who It's For
Grade 12 Statistics and AP-style students who can already use a calculator or software for regression. Pair it with a one-page anchor chart comparing r, r², and slope.
HSS-ID.C.8 asks students to compute, using technology, and interpret the correlation coefficient of a linear fit. This Grade 12 Statistics worksheet builds that skill through 16 tasks across 5 pages: students distinguish r from slope, calculate r, the least-squares line, r², and residuals from data, and critique claims about outliers, extrapolation, and causation. Because r has no units and is unchanged by rescaling while the slope carries units of y per unit of x, the tasks require students to explain statistics in context instead of reporting numbers alone. Fisher & Frey (2014) describe gradual release of responsibility, moving from teacher modeling to guided and independent work, as a reliable structure for building understanding; this worksheet follows that sequence with four concept items, eight short applications, and four written explanations. Teachers can use it as unit review, homework, or formative evidence of whether students understand what correlation and regression do and do not show.


