






















Printable Causal Claims Worksheet | Grade 12 Statistics

Paste this activity's link or code into your existing LMS (Google Classroom, Canvas, Teams, Schoology, Moodle, etc.).
Students can open and work on the activity right away, with no student login required.
You'll still be able to track student progress and results from your teacher account.
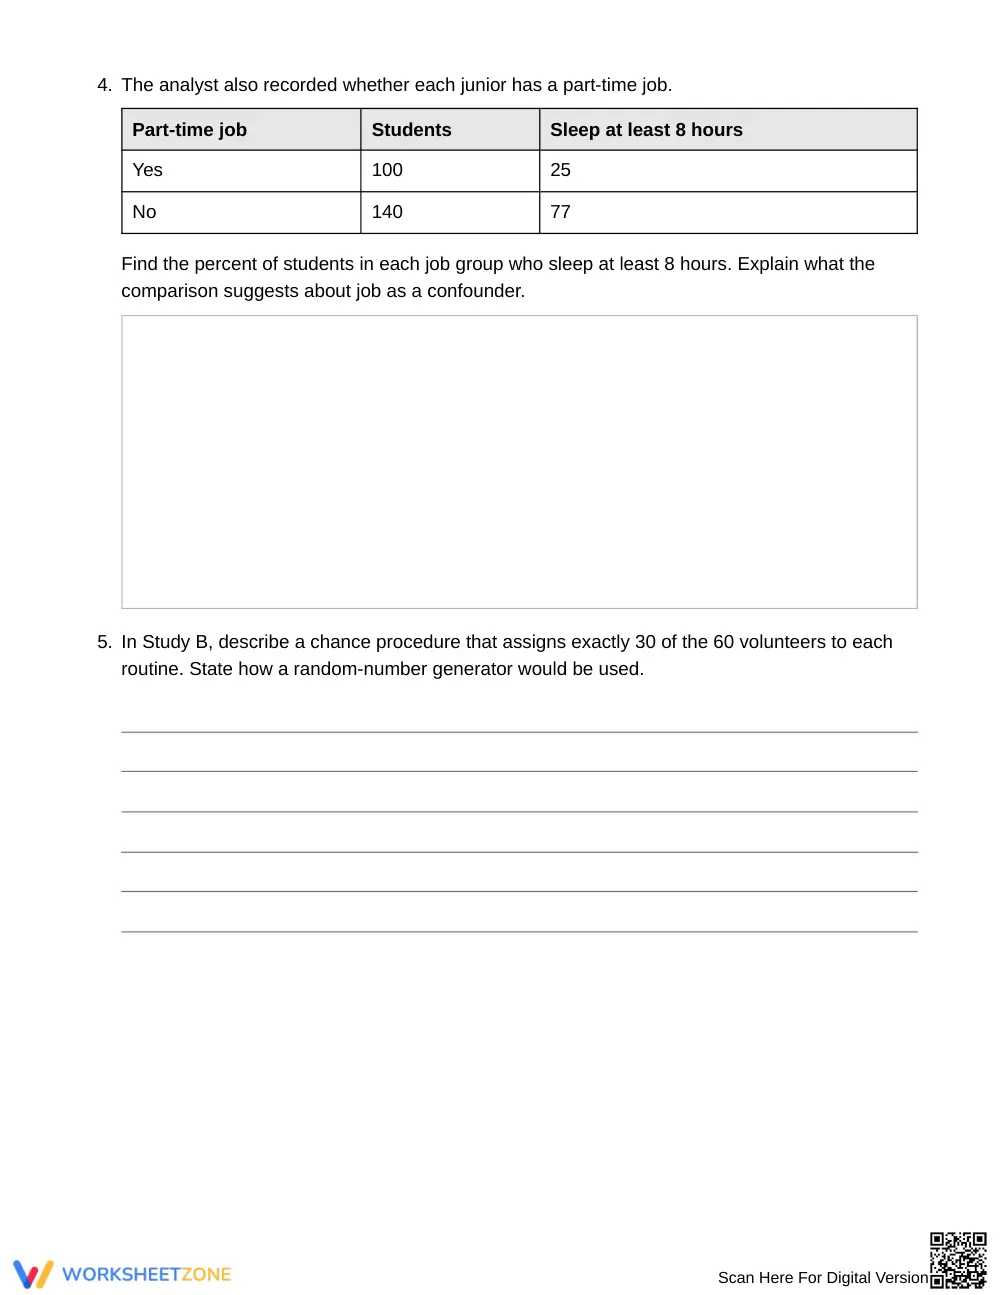
This Grade 12 Statistics worksheet teaches students to evaluate a causal claim by examining study design. Students identify study types, spot confounders, plan random assignment and blocking, and decide what a conclusion can support across two hypothetical studies.
At a Glance
- Grade: 12 · Subject: Statistics
- Standard:
HSS-IC.B.3— Tell study types apart and explain what randomization justifies- Skill Focus: Evaluate a causal claim from a study
- Format: 5 pages · 10 problems · Answer key included · PDF
- Best For: Experimental design unit practice and review
- Time: 35–45 minutes
What's Inside
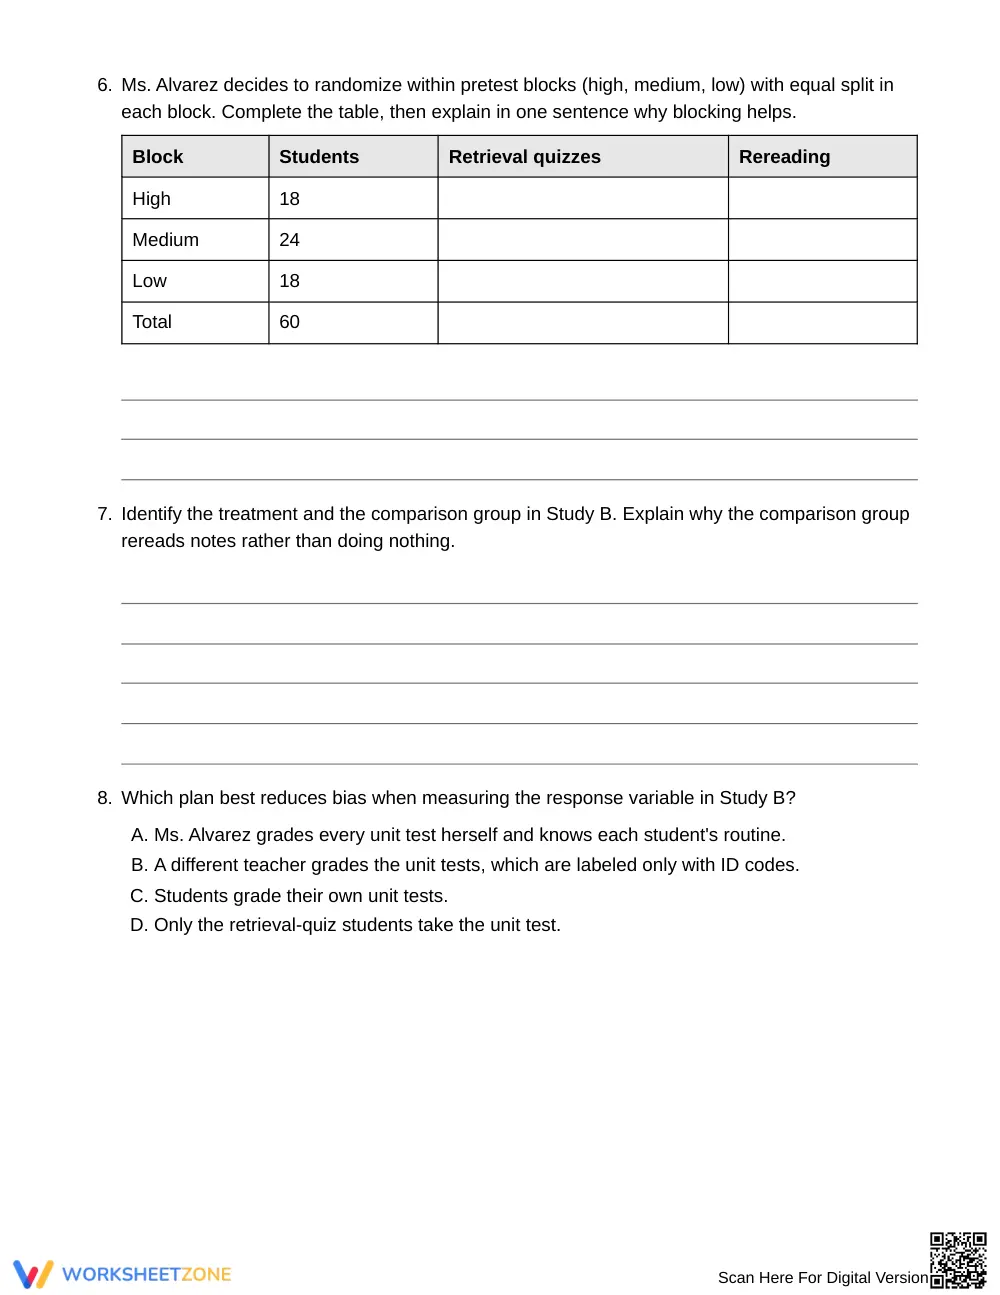
This 5-page PDF holds 10 tasks in three parts: identifying goals, specifying design decisions, and defending a feasible plan. A Key Ideas box defines each term, and a 3-page answer key supports quick checking.
Skill Progression
- Guided practice: 2 tasks (Part A) with a Key Ideas box that scaffolds study-type and variable identification.
- Supported practice: 6 tasks (Part B) on confounders, percent comparisons, random assignment, blocking, and bias, with tables to complete.
- Independent practice: 2 tasks (Part C) requiring a written defense that uses statistical vocabulary.
Together the parts follow gradual release: I Do, We Do, You Do.
Standards Alignment
HSS-IC.B.3: Recognize the purposes of and differences among sample surveys, experiments, and observational studies; explain how randomization relates to each. Copy this code directly into lesson plans, IEP goals, or district curriculum mapping tools.
How to Use It
- After direct instruction on experimental design: assign as guided classwork, about 35–45 minutes.
- Before a unit test: assign Part C as review, then compare written defenses.
Formative tip: while students work, watch whether they separate random sampling from random assignment.
Who It's For
Grade 12 Statistics students finishing an experimental design unit. Students who need support can complete Parts A and B first. Pair it with an anchor chart comparing surveys, observational studies, and experiments.
Evaluating a Causal Claim from a Study is a Grade 12 Statistics worksheet aligned to HSS-IC.B.3, which asks students to recognize the purposes of and differences among sample surveys, experiments, and observational studies and to explain how randomization relates to each. In plain terms, students decide whether a study's design can support a cause-and-effect conclusion. The 10 tasks use two hypothetical studies: an observational sleep and exam score comparison and a randomized block experiment on retrieval quizzes. Students name confounders, calculate group percents, describe random assignment with a random-number generator, complete a blocking table, and judge a classmate's overgeneralized claim. The sequence follows the gradual release model described by Fisher & Frey (2014), moving from guided identification to independent defense of a feasible, ethical plan. An answer key is included for fast, consistent feedback on every task.


