


Views
Downloads
Grade 3 Graphing — Printable No-Prep Worksheet
Paste this activity's link or code into your existing LMS (Google Classroom, Canvas, Teams, Schoology, Moodle, etc.).
Students can open and work on the activity right away, with no student login required.
You'll still be able to track student progress and results from your teacher account.
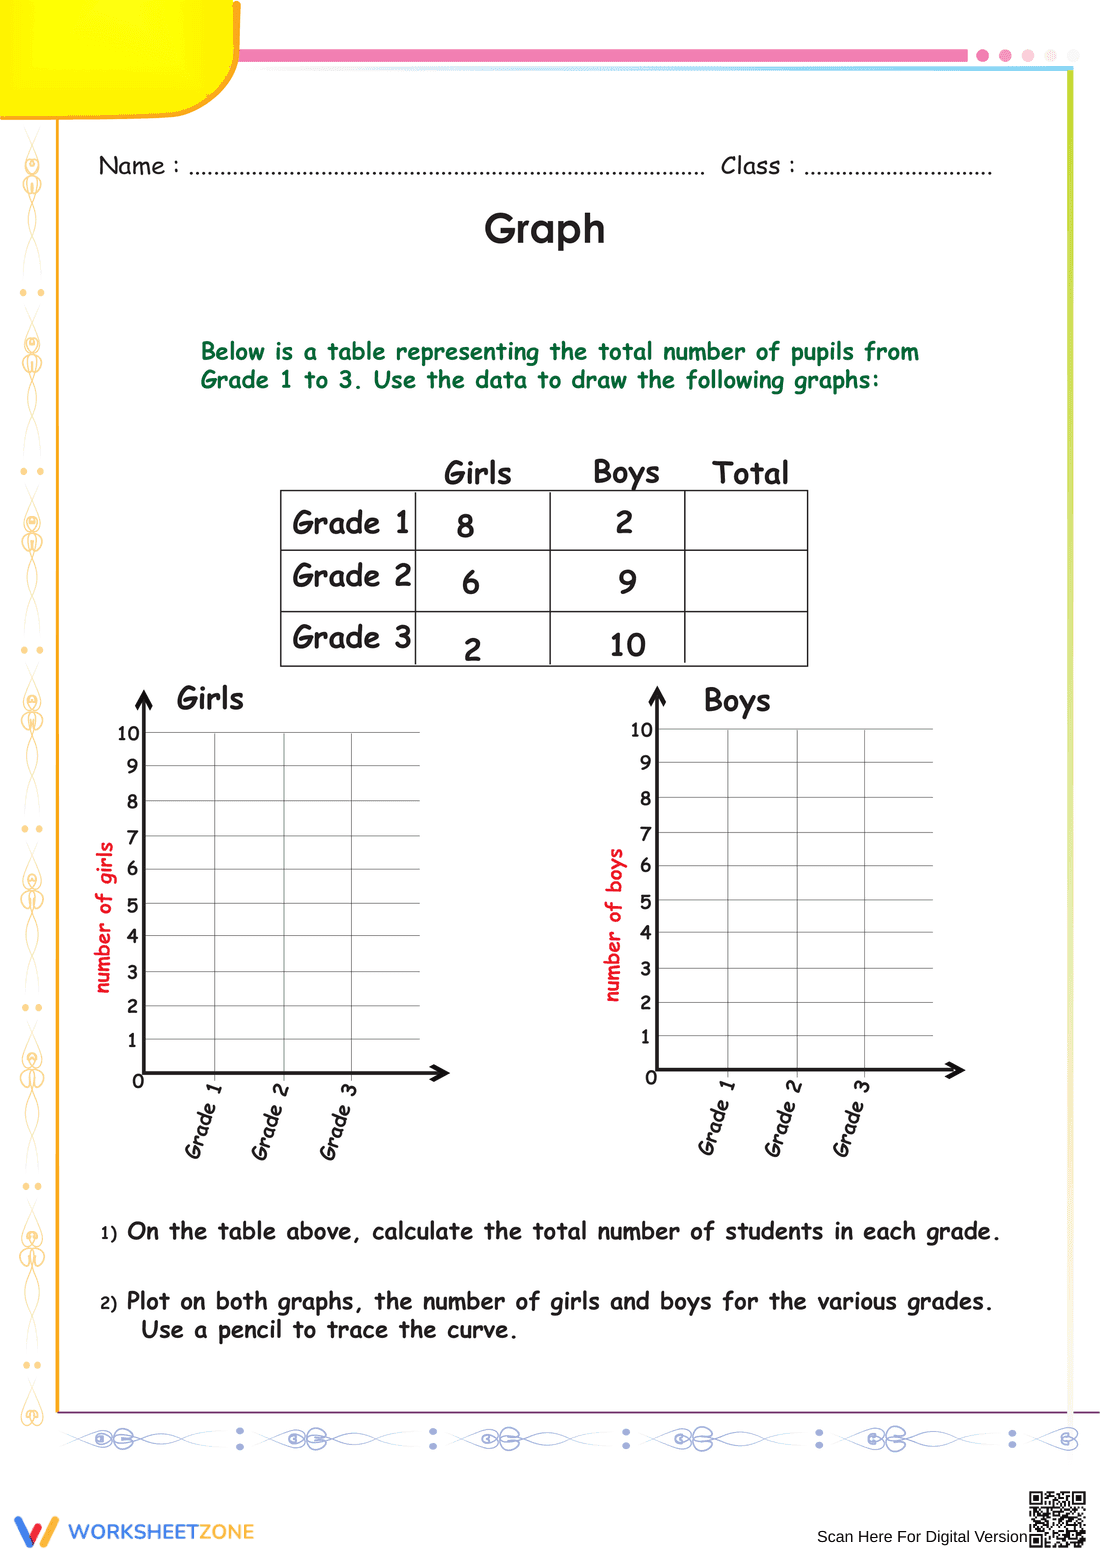
This worksheet gives Grade 3 students practice in representing data. Learners use a data table to calculate totals and then plot information for two categories onto line graphs, strengthening their data visualization skills. It's a clear, concise task for any math lesson.
At a Glance
- Grade: 3 · Subject: Math
- Standard:
CCSS.MATH.CONTENT.3.MD.B.3— Draw a scaled graph to represent a data set with several categories.- Skill Focus: Plotting data from a table onto a line graph
- Format: 2 pages · 2 problems · Answer key included · PDF
- Best For: Independent practice, formative assessment, homework
- Time: 15–20 minutes
What's Inside
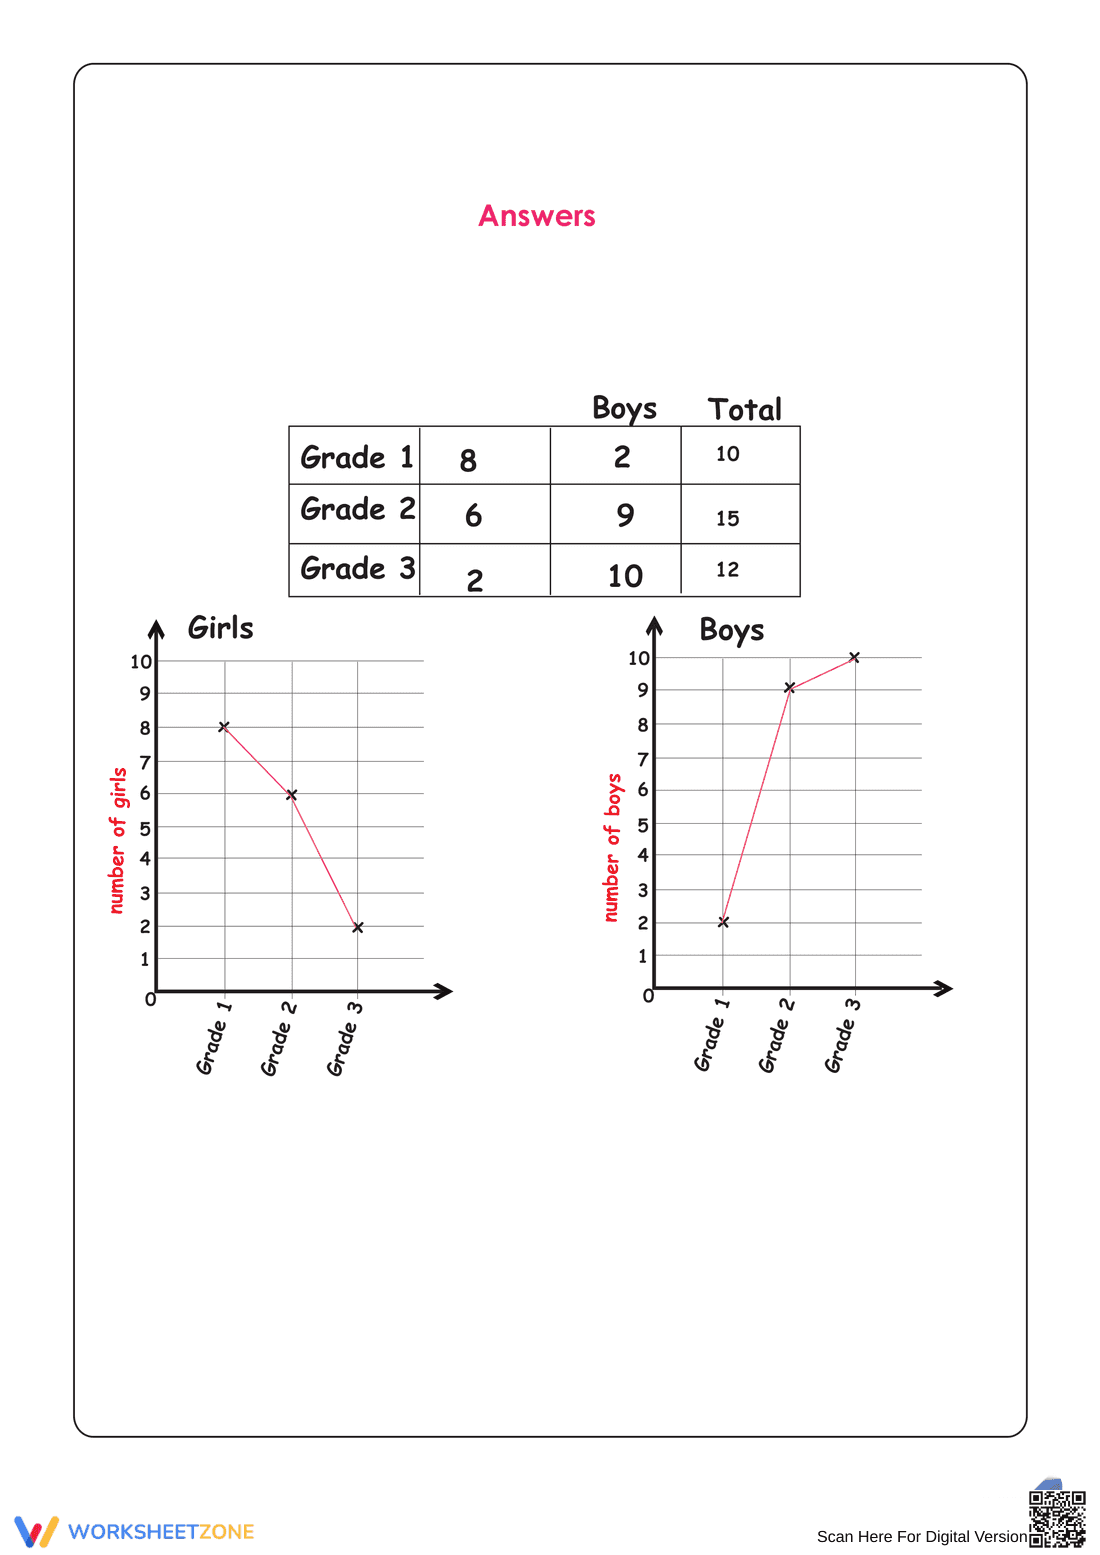
This two-page PDF contains a student worksheet and an answer key. The worksheet has a data table, two empty line graphs, and two instructions. The second page provides a complete answer key with the table filled out and graphs correctly plotted for immediate feedback or self-correction.
Zero-Prep Workflow
- Print (Under 1 minute): The single worksheet and answer key are ready for quick printing. No cutting or sorting needed.
- Distribute (Under 1 minute): Hand out the worksheet for immediate use. Clear instructions allow students to start with minimal teacher explanation.
- Review (5 minutes): Use the answer key to review answers as a class or in small groups. The visual graphs make for a quick check.
Total prep time is under two minutes, perfect for substitute plans or homework.
Standards Alignment
This worksheet aligns with the principles of CCSS.MATH.CONTENT.3.MD.B.3, which focuses on representing data sets. While the standard specifies bar graphs, this activity builds the same skill of translating tabular data into a scaled visual representation. The standard code can be copied directly into lesson plans or curriculum maps.
How to Use It
Use this worksheet for independent practice after a lesson on graphing. It serves as a great formative assessment to see who can transfer data points from a table to a graph. For an observation tip, watch if students connect the dots in the correct order. The activity should take about 15-20 minutes.
Who It's For
Designed for third-grade students, this resource works for on-level practice or as a review for fourth graders. It pairs well with an introductory lesson on different graph types and could follow the creation of an anchor chart defining the x-axis and y-axis.
Effective data representation is a critical component of elementary mathematics, providing the groundwork for future statistical analysis. This worksheet, aligned to CCSS.MATH.CONTENT.3.MD.B.3, provides students a concrete task to represent a data set with several categories. The National Assessment of Educational Progress (NAEP) has consistently shown that students need explicit practice in moving between different representations of data, such as tables and graphs. By requiring students to plot points and connect them to form a line graph, this activity addresses that need directly. As noted in the RAND AIRS 2024 report on foundational numeracy, the ability to interpret and create visual displays of information is a key indicator of mathematical literacy. This single-page resource offers a structured, standards-aligned opportunity for students to build that essential skill, transforming abstract numbers into a meaningful visual format.