


Views
Downloads
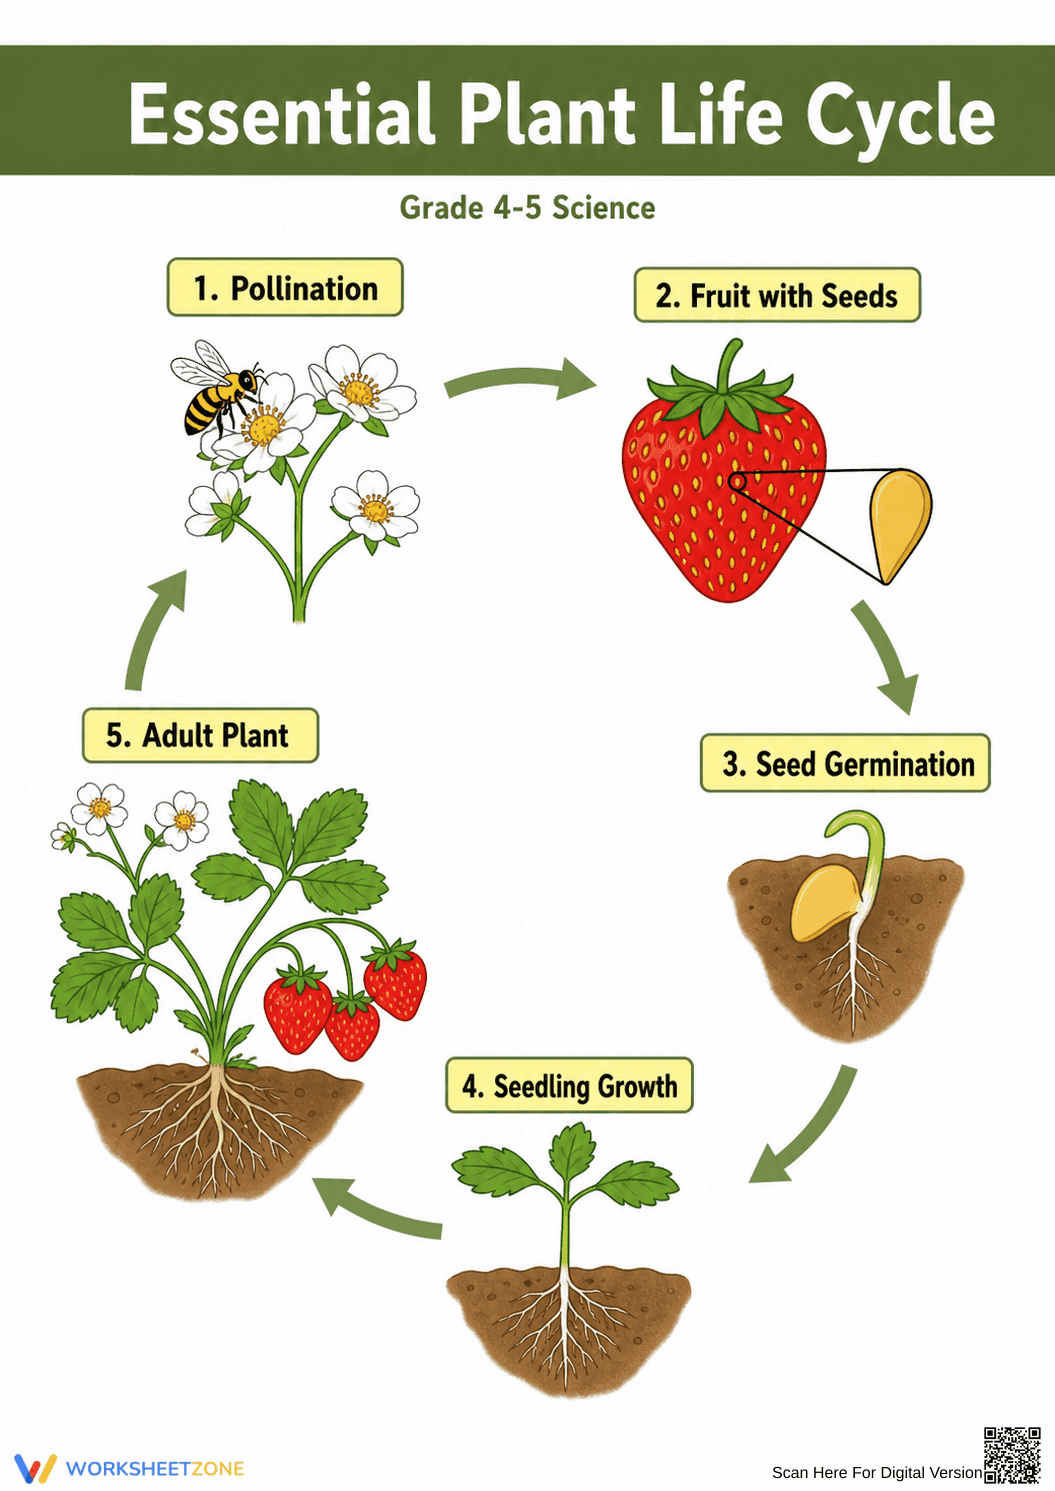
Essential Plant Life Cycle Diagram | Grade 4-5 Science
Paste this activity's link or code into your existing LMS (Google Classroom, Canvas, Teams, Schoology, Moodle, etc.).
Students can open and work on the activity right away, with no student login required.
You'll still be able to track student progress and results from your teacher account.
This Grade 4 and 5 plant life cycle diagram provides a clear visual model of biological progression. Students observe the transformation from seed to adult plant, identifying critical reproductive and growth phases. It serves as a foundational reference for understanding how flowering plants sustain their populations through sequential development stages.
At a Glance
- Grade: 4-5 · Subject: Science
- Standard:
3-LS1-1— Develop models to describe that organisms have unique and diverse life cycles- Skill Focus: Plant life cycle sequencing
- Format: 1 page · 5 stages · Reference Diagram · PDF
- Best For: Visual learners and science notebooks
- Time: 10–15 minutes
Inside this resource, you will find a high-resolution, full-color diagram of a strawberry plant's life cycle. The sheet explicitly labels five distinct phases: pollination, fruit development, seed germination, seedling growth, and the adult plant stage. The circular flow arrows emphasize the continuous nature of biological cycles, making it an ideal anchor chart for classroom walls or student binders.
This resource is designed for immediate implementation with a total teacher prep time of under 2 minutes. First, print the single-page PDF for your class or display it on a digital projector. Second, distribute the copies to students for inclusion in their science journals. Finally, review the five stages as a whole group to establish a shared vocabulary before moving into independent observations or garden activities.
This worksheet aligns with 3-LS1-1, requiring students to develop models to describe that organisms have unique and diverse life cycles. It also supports 4-LS1-1 by highlighting the external structures (flowers, fruit, seeds) that support survival and reproduction. Both standard codes can be copied directly into lesson plans, IEP goals, or district curriculum mapping tools.
Use this diagram during the "Explain" phase of a 5E instructional model. After students have explored real seeds or sprouts, use this sheet to formalize the names of each stage. It also functions as a formative assessment tool; ask students to cover the labels and describe the biological process occurring at each arrow. Completion typically takes 10 to 15 minutes during direct instruction.
This resource is perfect for upper elementary students, particularly visual learners who benefit from clear spatial representations of time-based processes. It pairs naturally with a hands-on bean planting experiment or a reading passage about pollinators. It is also a valuable modification for students requiring visual scaffolds in inclusive science classrooms.
According to the RAND AIRS 2024 report, visual models in science education significantly improve the retention of complex biological sequences among elementary learners. This diagram addresses the 3-LS1-1 standard by providing a concrete model of the birth, growth, and reproduction phases common to all flowering plants. By visualizing the transition from pollination to seed germination, students move beyond rote memorization toward a conceptual understanding of life science. Research from Fisher & Frey (2014) suggests that such graphic organizers serve as essential scaffolds during the gradual release of responsibility, allowing students to internalize the cyclical nature of life before engaging in more complex comparative biology. This 1-page reference ensures that every student has access to high-quality, standards-aligned visual information, reducing the cognitive load associated with abstract scientific concepts and promoting mastery of the life cycle curriculum.