


1 / 2
0
Views
0
Downloads
0.0
0
Save
0 Likes
Proportional Relationships: Graphing & Word Problems Worksheet
0 Views
0 Downloads
Paste this activity's link or code into your existing LMS (Google Classroom, Canvas, Teams, Schoology, Moodle, etc.).
Students can open and work on the activity right away, with no student login required.
You'll still be able to track student progress and results from your teacher account.
Information
Description
What It Is:
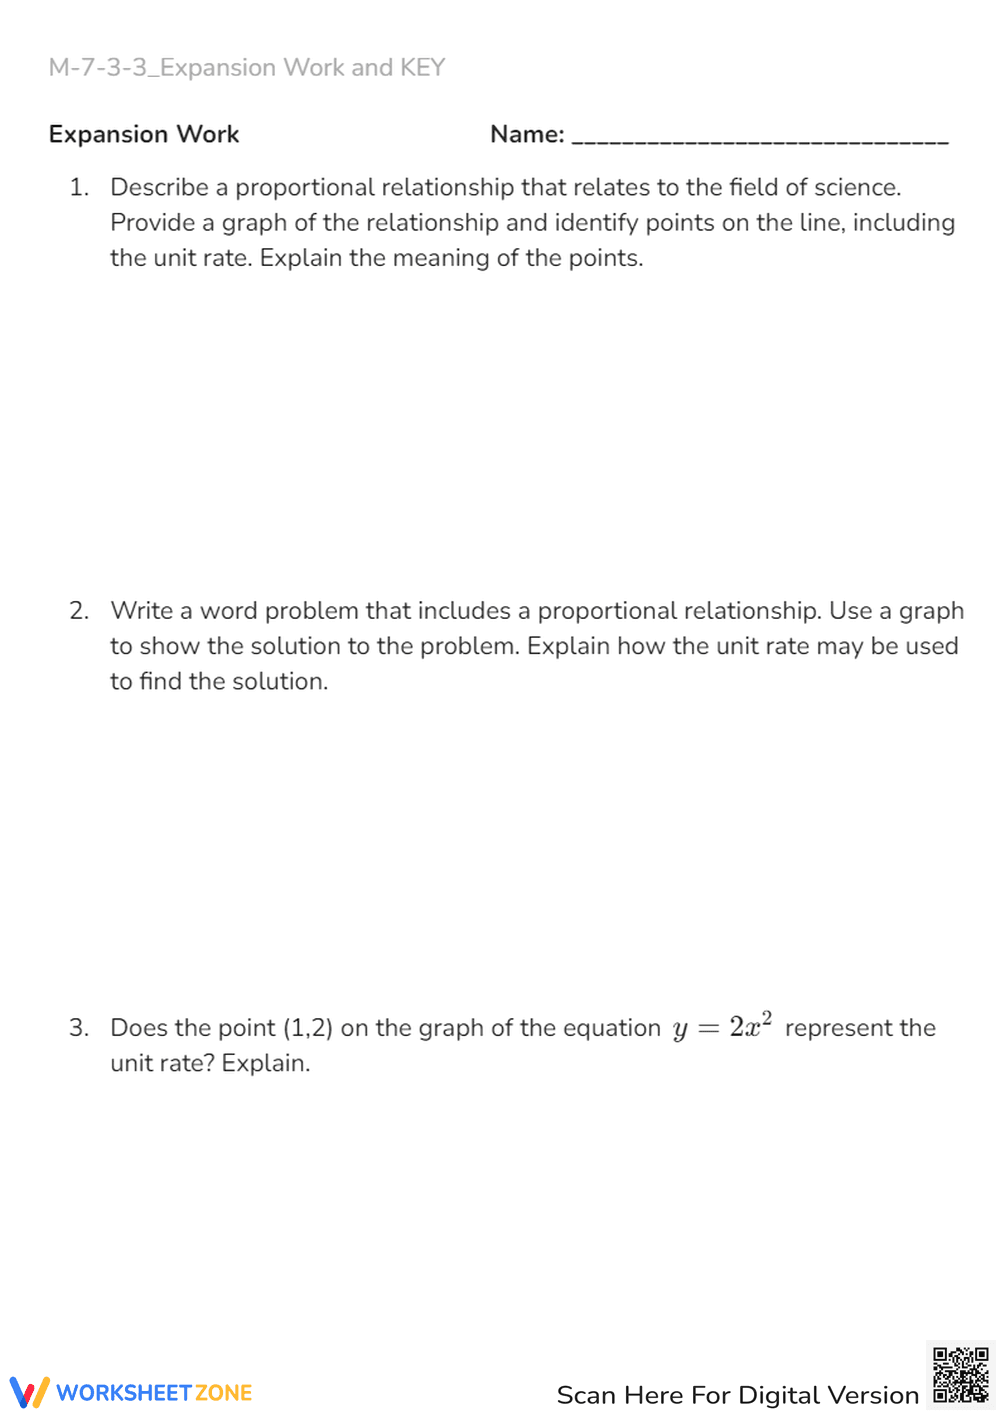
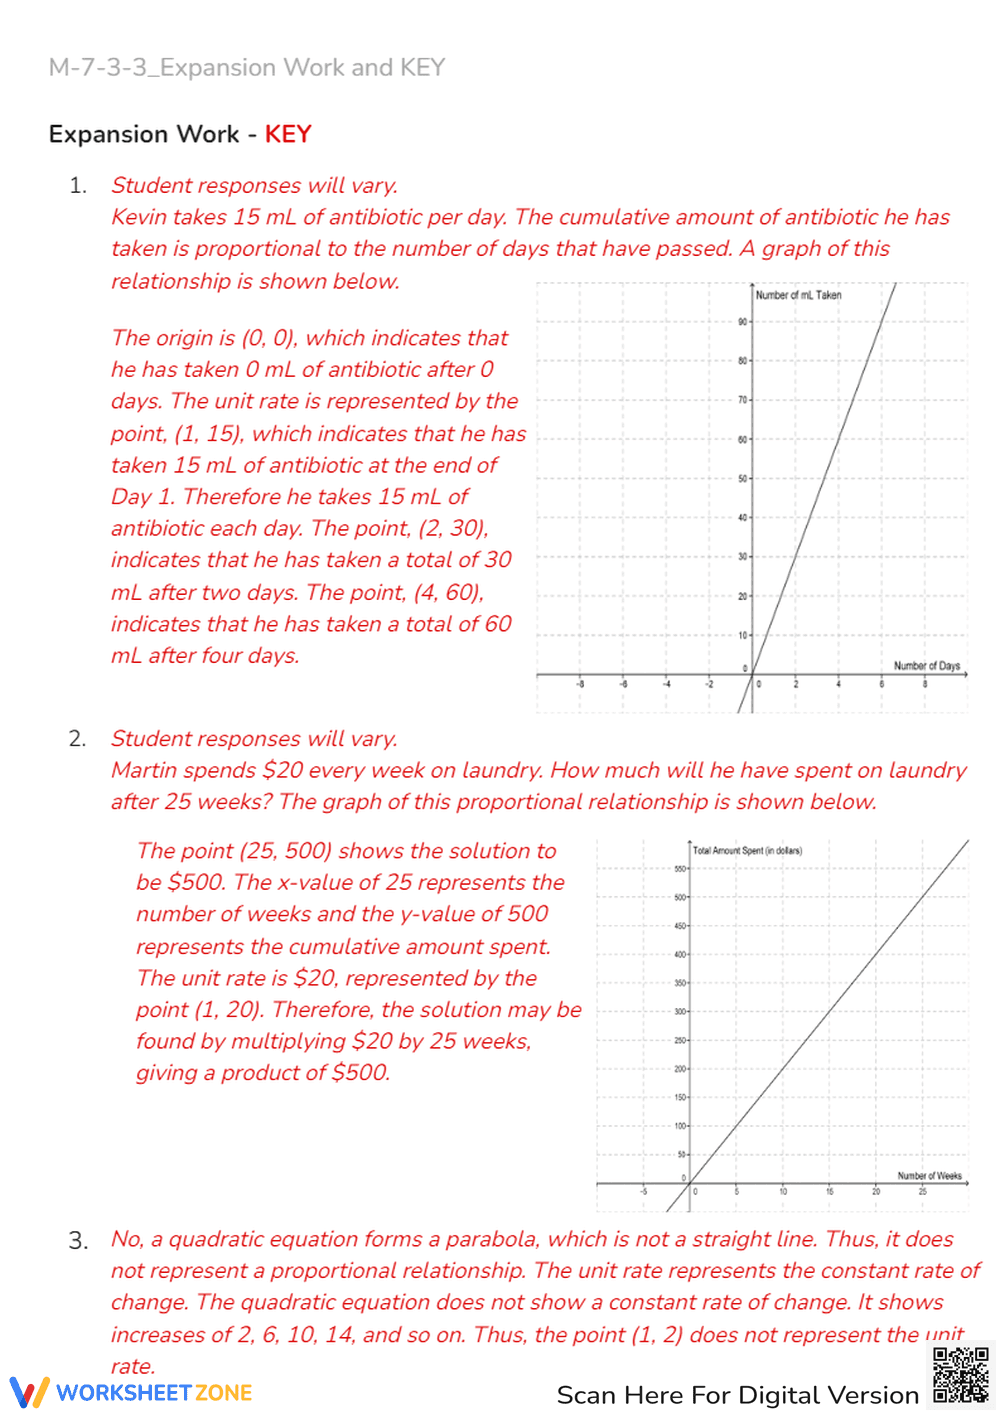
This is a math worksheet focusing on proportional relationships. It includes three problems. The first problem asks students to describe a proportional relationship related to science, provide a graph, and identify points including the unit rate. The second problem requires students to write a word problem involving a proportional relationship and use a graph to solve it. The third problem asks students to determine if the point (1,2) on the graph of the equation y = 2x^2 represents the unit rate and to explain their reasoning.
Grade Level Suitability:
This worksheet is suitable for grades 7-8. The concepts of proportional relationships, graphing, and unit rate are typically introduced and reinforced at these grade levels. The complexity of the word problem and the analysis of the equation y = 2x^2 also suggest this grade range.
Why Use It:
This worksheet helps students apply their understanding of proportional relationships in a real-world context, particularly in science. It promotes critical thinking by requiring them to create their own word problems and analyze graphs. It also reinforces the concept of unit rate and its representation in different forms.
How to Use It:
Students should read each problem carefully and show their work. For the first problem, they should choose a relevant scientific context and create a graph illustrating the proportional relationship. For the second problem, they should create a clear and solvable word problem and accurately graph the solution. For the third problem, they should substitute the values and explain their reasoning clearly.
Target Users:
This worksheet is designed for students in middle school (grades 7-8) who are learning about proportional relationships, graphing, and unit rates. It is suitable for classroom practice, homework assignments, or review activities.