


Views
Downloads

Grade 2 Graphing — Printable No-Prep Worksheet
Paste this activity's link or code into your existing LMS (Google Classroom, Canvas, Teams, Schoology, Moodle, etc.).
Students can open and work on the activity right away, with no student login required.
You'll still be able to track student progress and results from your teacher account.
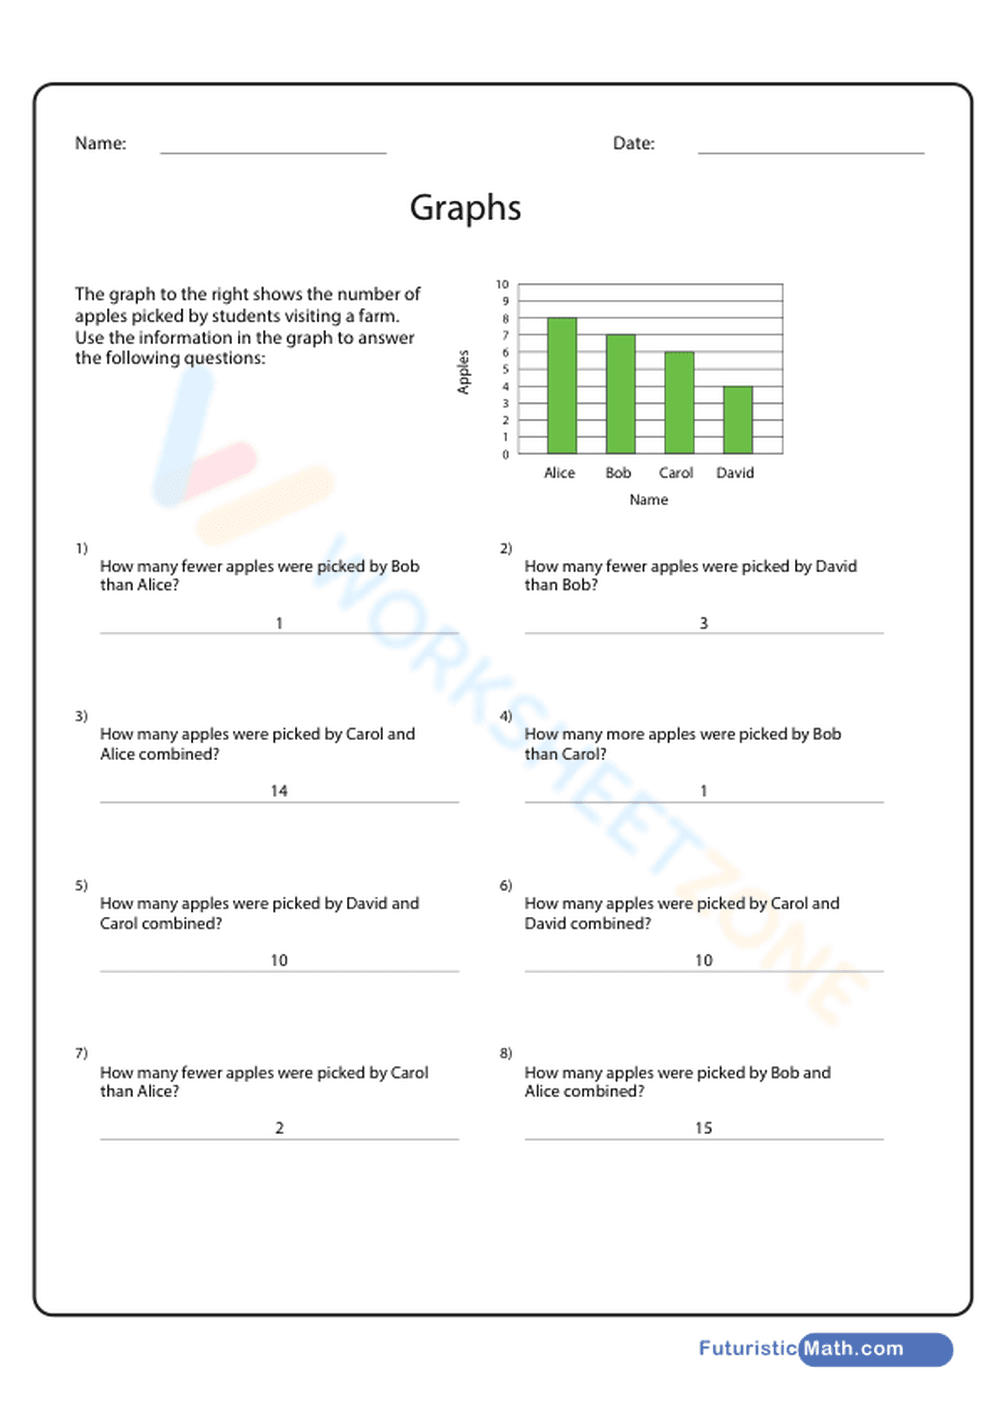
This second-grade math worksheet offers practice in reading and interpreting single-unit bar graphs. Students answer eight targeted questions, strengthening their ability to compare data points and solve simple problems based on the graph. This resource helps build foundational data analysis skills in a clear, student-friendly format.
At a Glance
- Grade: 2 · Subject: Math
- Standard:
CCSS.MATH.CONTENT.2.MD.D.10— Solve compare problems using information from a bar graph.- Skill Focus: Interpreting Bar Graphs
- Format: 2 pages · 8 problems · Answer key included · PDF
- Best For: Independent practice, math centers, formative checks
- Time: 10–15 minutes
What's Inside
This two-page PDF includes a student worksheet and an answer key. The main page presents a clean bar graph with four data categories. The eight questions challenge students to find totals, calculate differences, and make direct comparisons using the graph's data.
A Zero-Prep Workflow for Busy Teachers
This resource is designed for efficiency. The entire activity is ready in under two minutes: 1. Print (1 min): Print the worksheet for students and the key for yourself. 2. Distribute (30 sec): Hand it out for a warm-up, station, or homework. No other materials are needed. 3. Review (5 min): Use the key for whole-class review or rapid grading. It's ideal for sub plans or anytime you need a quality task without setup.
Standards Alignment for Your Lesson Plans
This worksheet is aligned with CCSS.MATH.CONTENT.2.MD.D.10, where students solve "put-together, take-apart, and compare problems using information presented in a bar graph." It also supports foundational skills for third-grade standard 3.MD.B.3. Both standard codes can be copied directly into lesson plans, IEP goals, or district curriculum mapping tools.
How to Use It in Your Classroom
Use this worksheet for independent practice after a graphing lesson or as a math center task. For a quick formative assessment, circulate as students work, noting how they use the graph to answer the questions. Most second graders can complete the activity in 10 to 15 minutes.
Who It's For
This resource is for second graders learning to interpret bar graphs. It's also suitable for advanced first graders or as review for third graders. It pairs well with a hands-on activity where students first build the graph with manipulatives before using the worksheet.
This worksheet provides practice on interpreting bar graphs, a skill aligned with CCSS.MATH.CONTENT.2.MD.D.10. By asking students to solve problems using graphical data, the activity supports quantitative reasoning. Research from the NAEP shows that engaging with data representation builds mathematical proficiency. This resource applies these findings, allowing students to translate visual information into numerical answers. It provides the structured repetition needed for fluency in reading bar graphs, a foundational skill for future statistics work. The included answer key facilitates immediate feedback, a practice Fisher & Frey (2014) identify as critical for learning.