


Views
Downloads

Grade 2 Bar Graphs — Printable No-Prep Worksheet
Paste this activity's link or code into your existing LMS (Google Classroom, Canvas, Teams, Schoology, Moodle, etc.).
Students can open and work on the activity right away, with no student login required.
You'll still be able to track student progress and results from your teacher account.
Master Bar Graphs in Minutes
This ready-to-use worksheet helps second-grade students master the skill of reading bar graphs. Through a focused activity, learners practice pulling data points from a graph and identifying key features, building a foundational understanding of data representation.
At a Glance
- Grade: 2 · Subject: Math
- Standard:
CCSS.MATH.CONTENT.2.MD.D.10— Represent and interpret data using a bar graph.- Skill Focus: Reading and Interpreting Bar Graphs
- Format: 2 pages · 6 problems · Answer key included · PDF
- Best For: Independent practice, homework, or formative assessment
- Time: 10–15 minutes
What's Inside
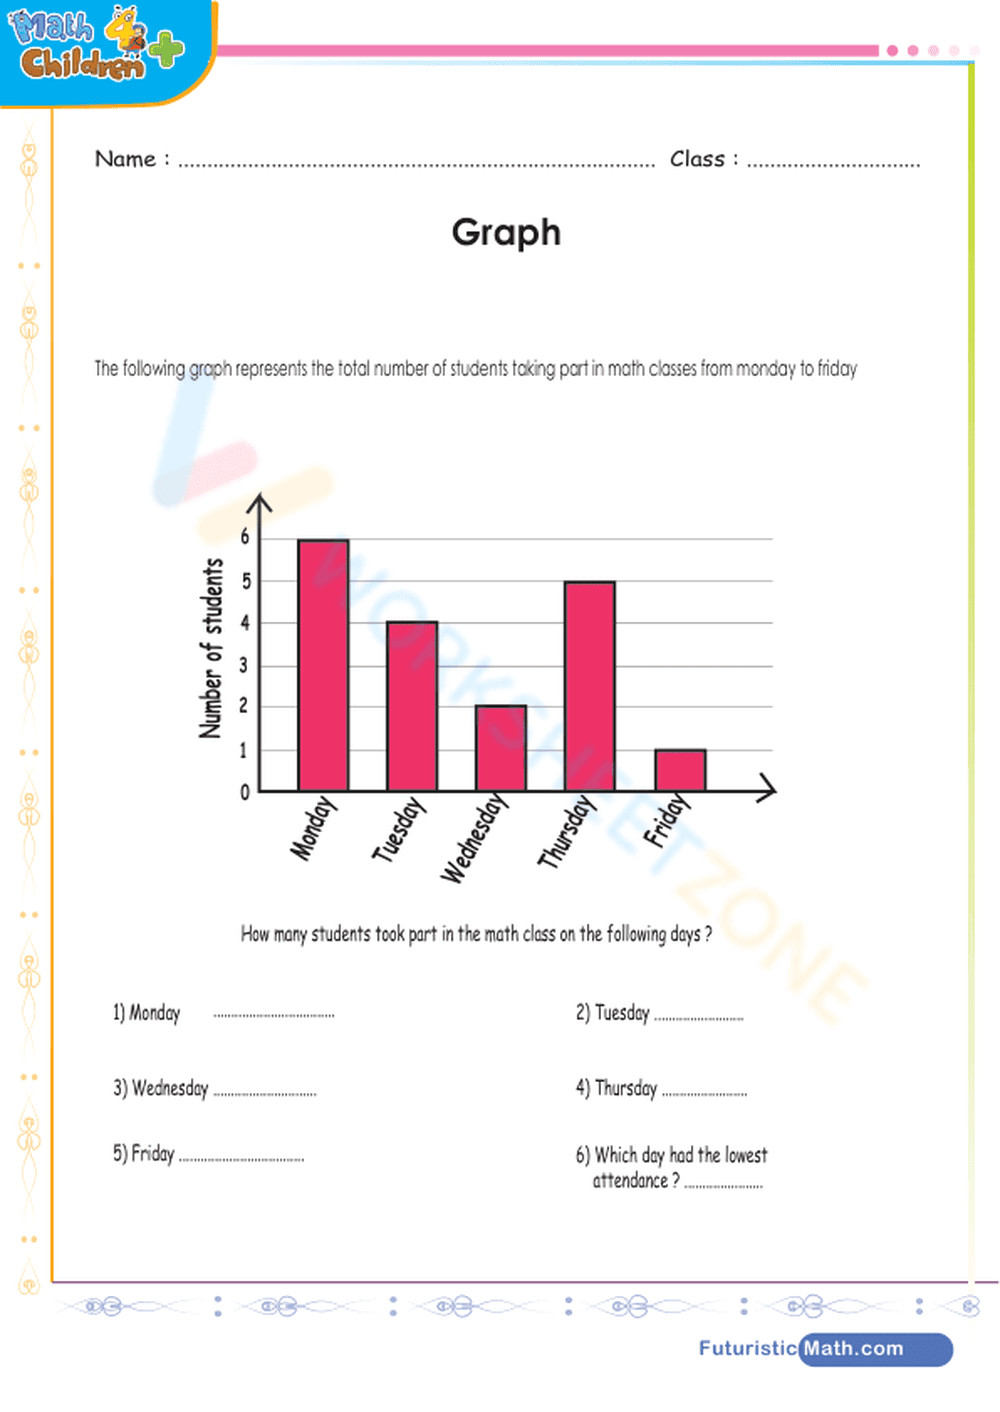
This two-page PDF contains a single worksheet and a complete answer key. The worksheet presents a bar graph of daily attendance. Students answer six questions that require them to read values and identify the lowest attendance day.
A Zero-Prep Workflow
Designed for efficiency, this worksheet follows a simple workflow taking under two minutes.
- Print (30 seconds): The PDF is formatted for immediate printing.
- Distribute (1 minute): The straightforward layout can be handed out with minimal explanation.
- Review (1 minute): Use the included answer key for quick grading or student self-correction.
This resource is ideal for a math warm-up, a substitute plan, or a no-setup homework assignment.
Standards Alignment
This worksheet aligns with CCSS.MATH.CONTENT.2.MD.D.10, which requires students to "solve simple...compare problems using information presented in a bar graph." The tasks provide practice on the interpretation and comparison parts of this standard. The code can be copied directly into lesson plans or curriculum maps.
How to Use It
Use this worksheet as independent practice after a lesson on reading bar graphs. It serves as a quick formative assessment. Observe if students correctly match the day to the bar and read the y-axis scale. The activity should take 10-15 minutes. For a follow-up, have students create their own questions about the graph.
Who It's For
This resource is for second-grade students learning about data. The clean layout is accessible for all learners. It pairs well with an introductory lesson using an anchor chart that labels the parts of a bar graph. The clear task ensures students can work independently with confidence.
This worksheet provides practice on interpreting bar graphs, a data literacy skill aligned with standard CCSS.MATH.CONTENT.2.MD.D.10. By having students extract and compare information, it builds the groundwork for complex analysis in later grades. The RAND AIRS 2024 report on elementary mathematics notes that early exposure to data representation is critical for quantitative reasoning. The 6 targeted questions offer a concise activity that reinforces solving problems using a bar graph. This skill is a prerequisite for understanding charts, tables, and infographics in academic and real-world contexts. The worksheet serves as an effective tool for providing the structured, independent practice recommended by researchers to solidify mathematical fluency.