


0
Views
0
Downloads
0.0
0
Save
0 Likes
Graph It: Siblings Data Graphing Worksheet
0 Views
0 Downloads
Paste this activity's link or code into your existing LMS (Google Classroom, Canvas, Teams, Schoology, Moodle, etc.).
Students can open and work on the activity right away, with no student login required.
You'll still be able to track student progress and results from your teacher account.
Information
Description
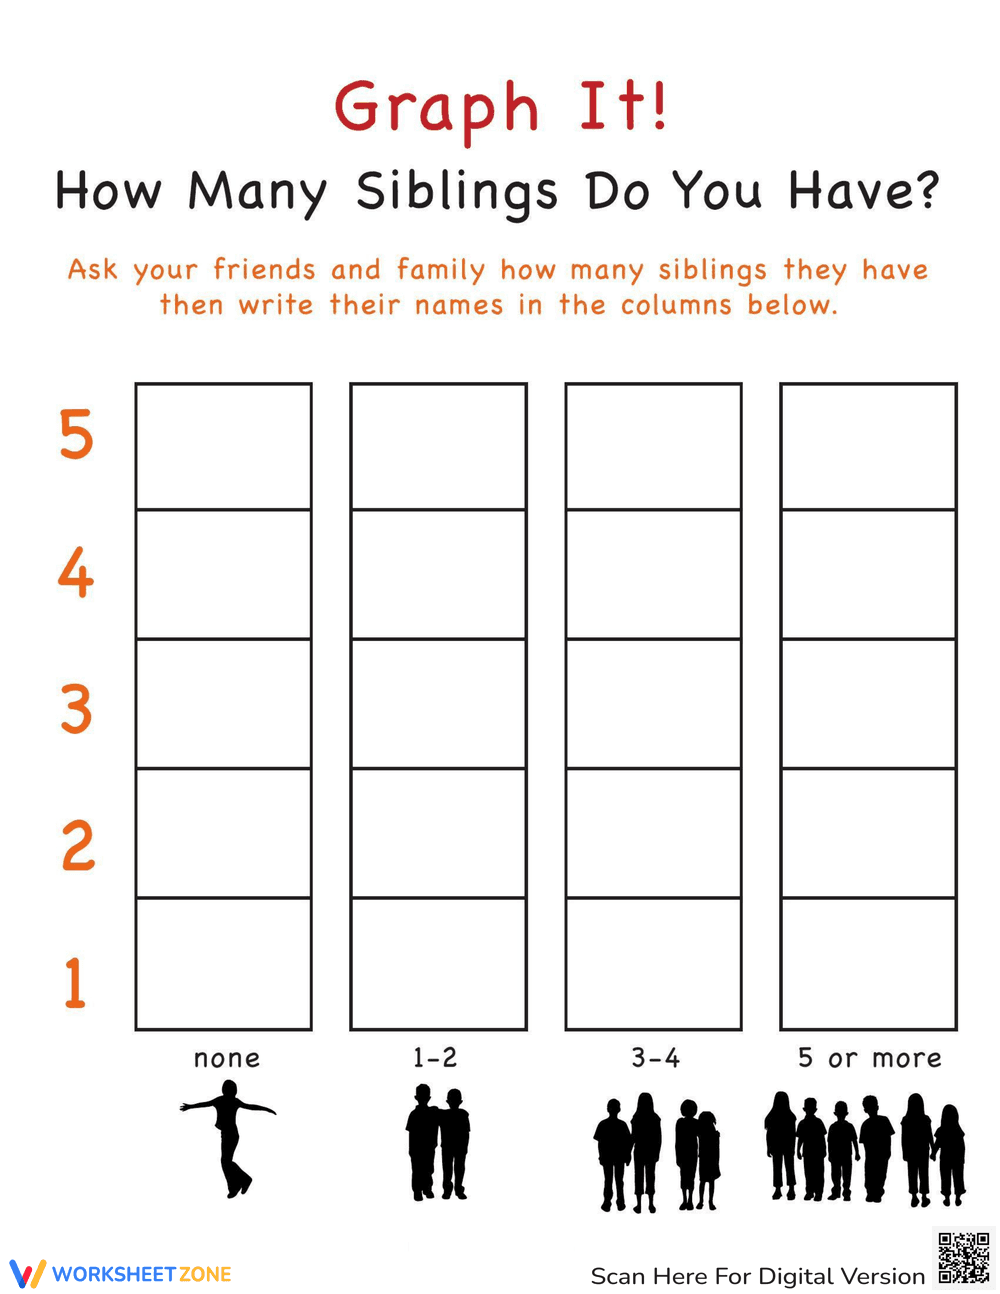
What It Is:
This is a worksheet titled 'Graph It! How Many Siblings Do You Have?'. It prompts students to ask friends and family about the number of siblings they have and then record their names in a bar graph format. The graph has four columns representing different sibling ranges: 'none,' '1-2,' '3-4,' and '5 or more.' The y-axis is numbered from 1 to 5, providing space to write names for each sibling count.
Grade Level Suitability:
This worksheet is suitable for grades 1-3. It involves simple data collection and graphing, which aligns with the math skills taught in these grades. The concept of siblings is relatable, making it engaging for young learners.
Why Use It:
This worksheet helps students practice data collection, organization, and graphing skills. It introduces the concept of bar graphs in a simple and engaging way. It also promotes social interaction as students need to ask their friends and family for information.
How to Use It:
First, have students ask their friends and family how many siblings they have. Then, for each person, they should write their name in the appropriate column based on the number of siblings they have. For example, if someone has 2 siblings, their name goes in the '1-2' column. Students can write multiple names in each box to represent multiple people with the same number of siblings.
Target Users:
This worksheet is designed for elementary school students, particularly those in grades 1-3, who are learning about data collection and graphing. It's also useful for teachers looking for a fun and interactive way to introduce bar graphs.