

































Essential Trend Predictions Worksheet | Grade 8 Math

Paste this activity's link or code into your existing LMS (Google Classroom, Canvas, Teams, Schoology, Moodle, etc.).
Students can open and work on the activity right away, with no student login required.
You'll still be able to track student progress and results from your teacher account.
This Grade 8 mathematics worksheet equips students to critically evaluate bivariate data models, understand interpolation versus extrapolation, and explain why similar linear trends can yield conflicting predictions. Through 14 rigorous analytical tasks, learners investigate rates of change, initial values, domain limits, subgroup aggregation, and real-world boundary constraints across practical contexts.
At a Glance
- Grade: 8 · Subject: Math
- Standard: Interpret scatter plots, linear models, and bivariate associations within contextual domain boundaries.
- Skill Focus: Diverging trends, interpolation, extrapolation, and constraint modeling
- Format: 5 pages · 14 problems · Answer key included · PDF
- Best For: Bivariate data modeling and linear analysis practice
- Time: 45–60 minutes
What's Inside
The 5-page student activity provides 14 structured problems organized into three progressive parts. It features scatter plot visualizations, side-by-side linear equations, contextual scenario tables, and a full 3-page worked answer key with step-by-step mathematical justifications and boundary checks.
Skill Progression
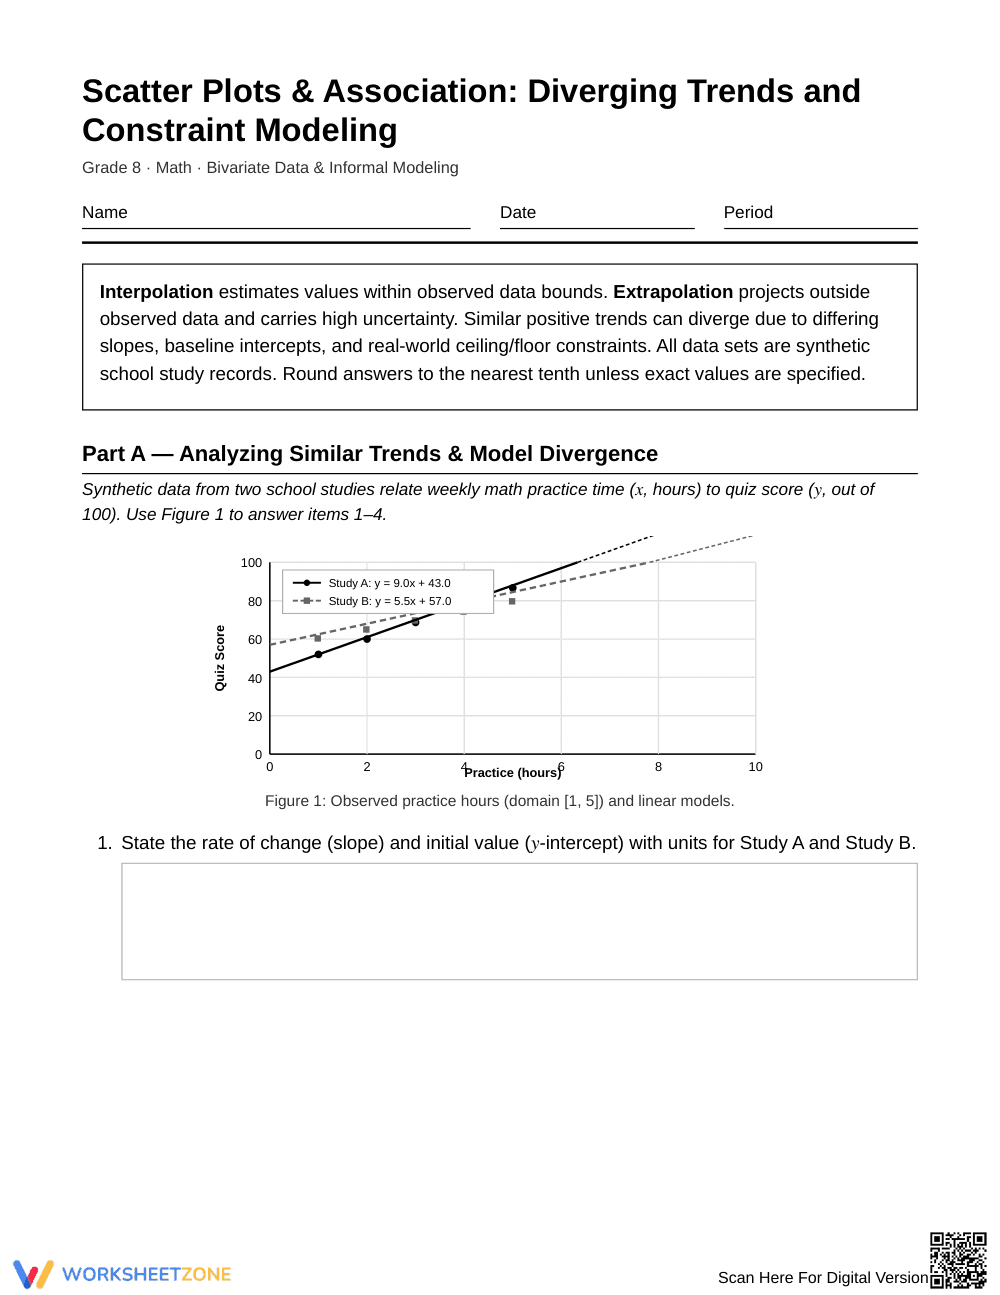
- Guided practice (Items 1–4): Students compare two linear models with positive slopes on a shared domain, interpolate intermediate values, extrapolate beyond observed bounds, and identify physical ceiling constraint violations.
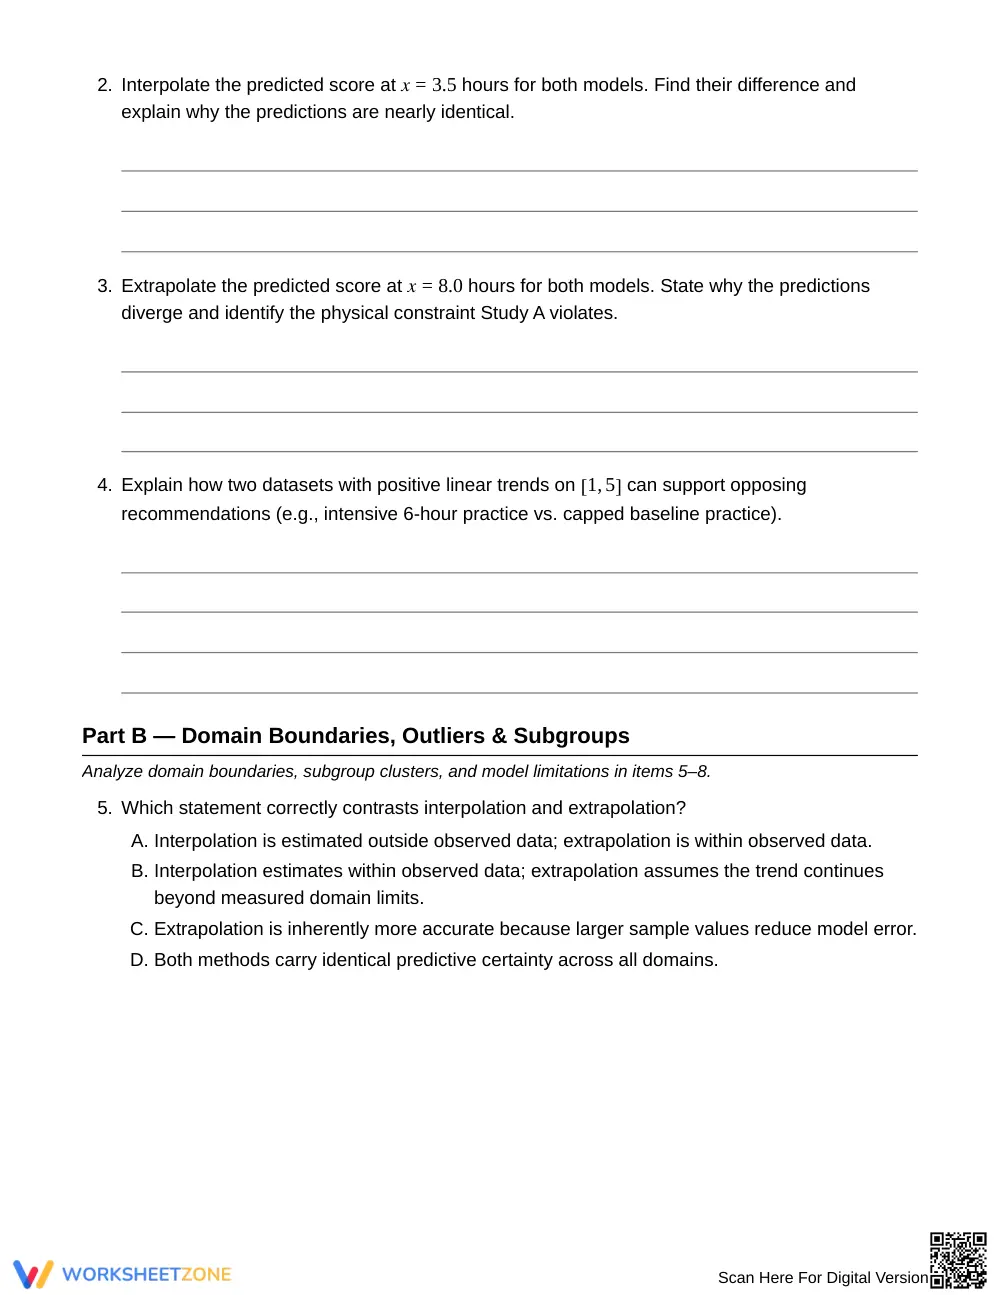
- Supported practice (Items 5–8): Learners analyze domain boundaries, distinguish valid interpolation from speculative extrapolation, calculate aggregation error across distinct subgroups, and identify real-world floor limits.
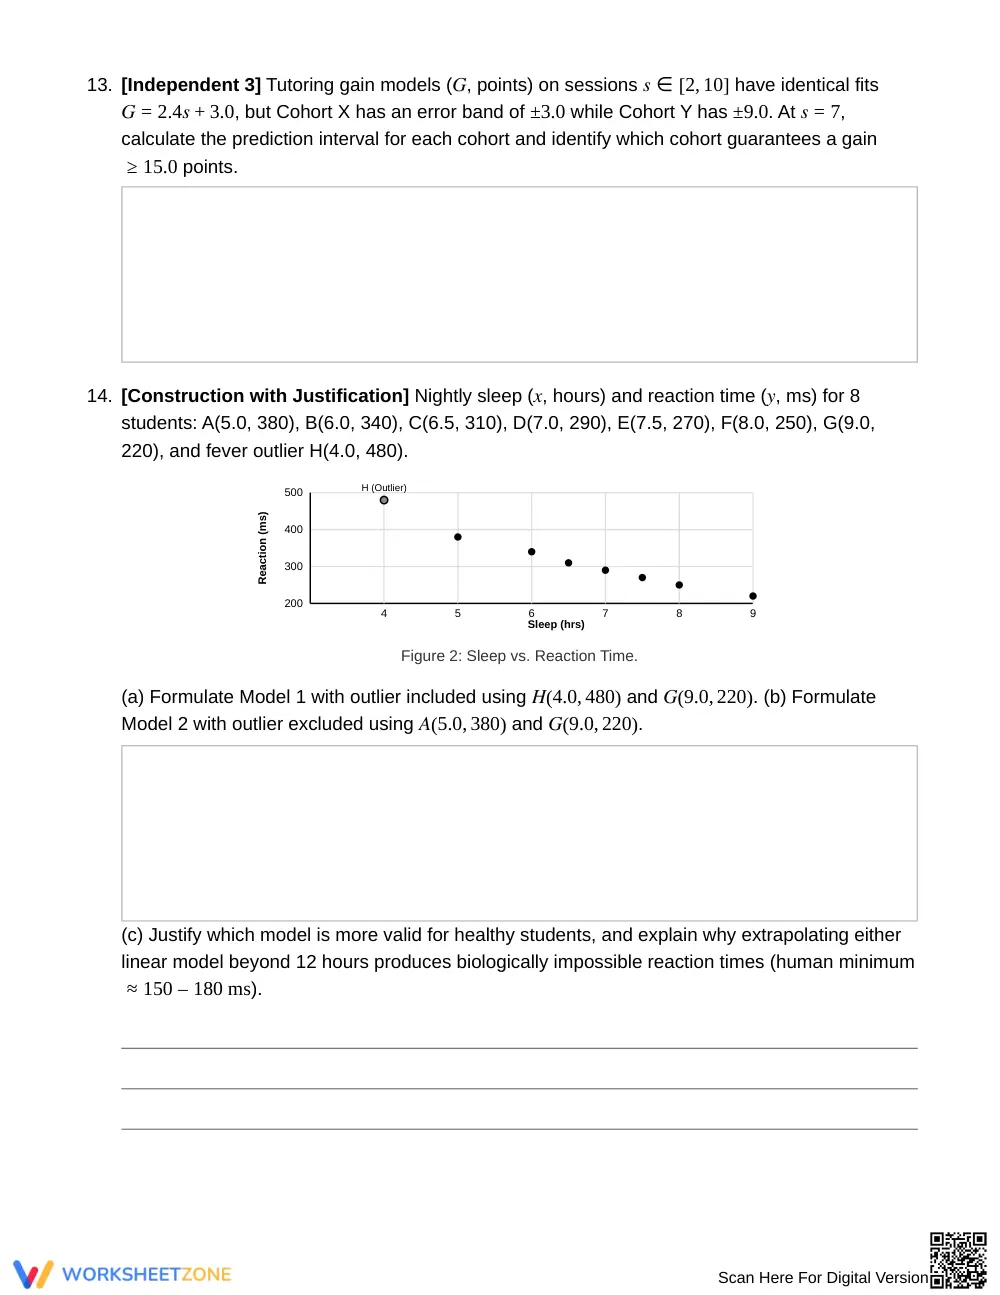
- Independent practice (Items 9–14): Students independently solve multi-step constraint problems involving candidate model testing, breakeven points, error bands, and line-of-best-fit formulation with outlier removal.
This structured sequence follows a gradual-release instructional model that moves students from scaffolded graphical interpretation to independent algebraic modeling.
Standards Alignment
This worksheet addresses Grade 8 bivariate data standards requiring students to construct and interpret scatter plots, fit linear models, and use equations to solve real-world problems. Students examine slope and intercept meaning, evaluate model fit, and critique predictions when extending lines beyond observed domain limits. Both standard concepts can be copied directly into lesson plans, IEP goals, or district curriculum mapping tools.
How to Use It
Deploy this resource during the second half of a bivariate data unit following initial instruction on lines of best fit. It functions effectively as a collaborative partner investigation or as an individual formative assessment. While students work through Part B, observe whether they check domain bounds before calculating extrapolated values. The full activity requires approximately 45 to 60 minutes of instructional time.
Who It's For
This resource is designed for Grade 8 pre-algebra or Algebra I students learning linear modeling. It supports differentiated math intervention by providing clear visual contexts alongside rigorous algebraic extensions. Pair this worksheet with an anchor chart comparing interpolation and extrapolation.
According to Fisher & Frey (2014), structured progression through guided, collaborative, and independent modeling tasks significantly enhances mathematical reasoning and data literacy. When eighth-grade students analyze bivariate associations, identifying why similar positive slopes produce divergent long-term predictions builds critical statistical intuition. This 14-item resource engages learners in evaluating slope sensitivity, baseline intercepts, subgroup aggregation risks, and contextual ceiling or floor constraints across 5 comprehensive pages. By evaluating synthetic school and science datasets, students bridge visual scatter plot analysis with formal linear equations. The included 3-page answer key supports immediate instructional feedback and self-assessment, reinforcing rigorous domain analysis and mathematical modeling standards across general education and intervention classrooms.


