




























Essential Slope & Rate of Change Worksheet | Grade 8 Math
Paste this activity's link or code into your existing LMS (Google Classroom, Canvas, Teams, Schoology, Moodle, etc.).
Students can open and work on the activity right away, with no student login required.
You'll still be able to track student progress and results from your teacher account.
This Grade 8 mathematics worksheet provides targeted practice calculating slope and interpreting linear rates of change from coordinates, tables, and graphs. Students move from core formula calculations to multi-step real-world scenarios, building conceptual fluency across mathematical and contextual representations.
At a Glance
- Grade: 8 · Subject: Math
- Standard: Rate of Change — Calculate slope and interpret unit rates in contextual mathematical models
- Skill Focus: Slope formula, rates of change, collinearity, graphing
- Format: 5 pages · 16 problems · Answer key included · PDF
- Best For: Mid-unit practice or mastery check
- Time: 40–50 minutes
What's Inside
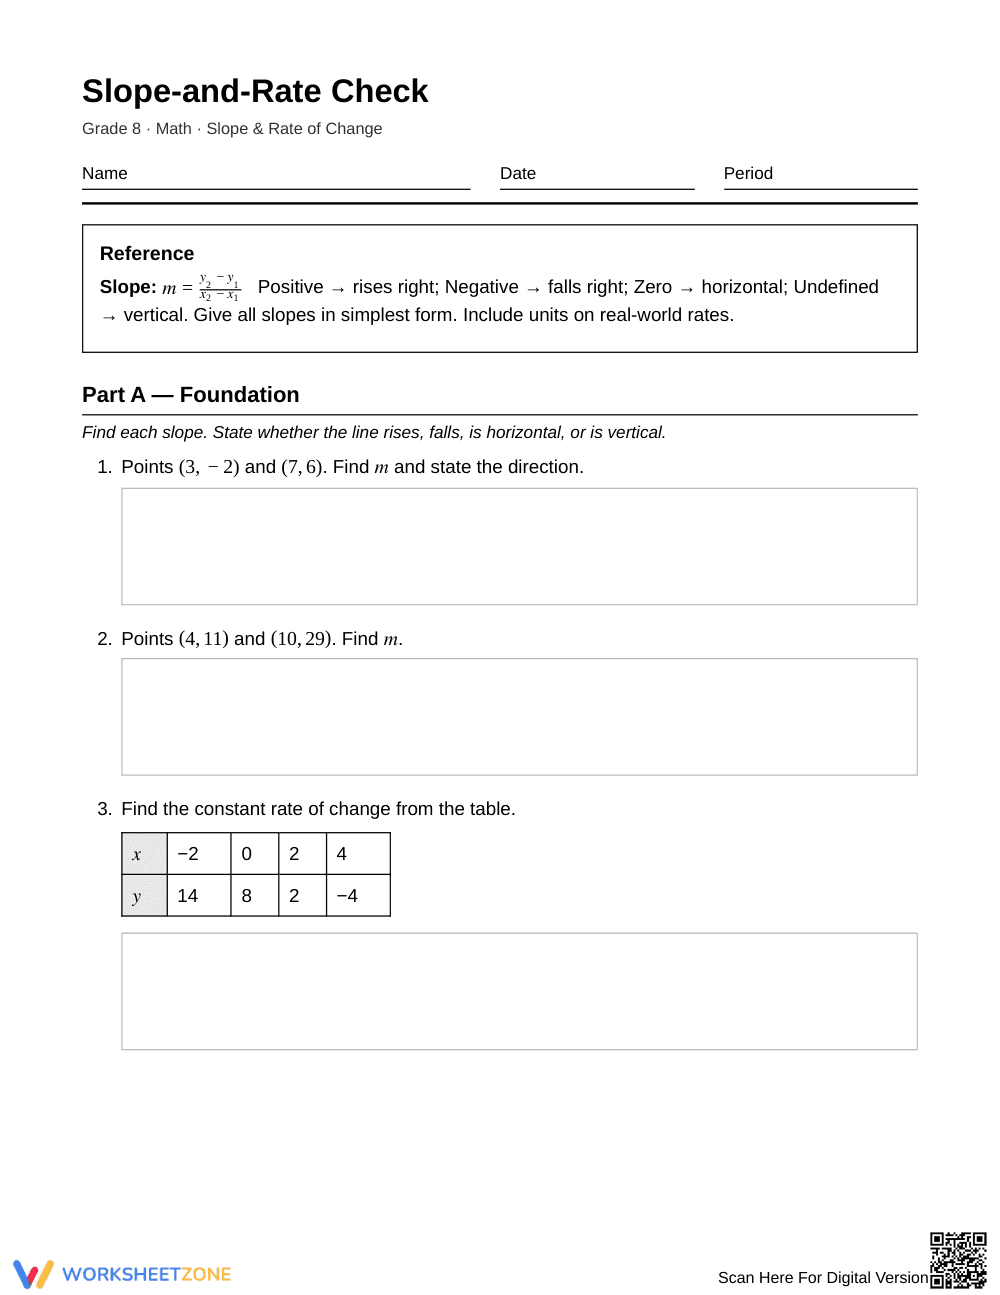
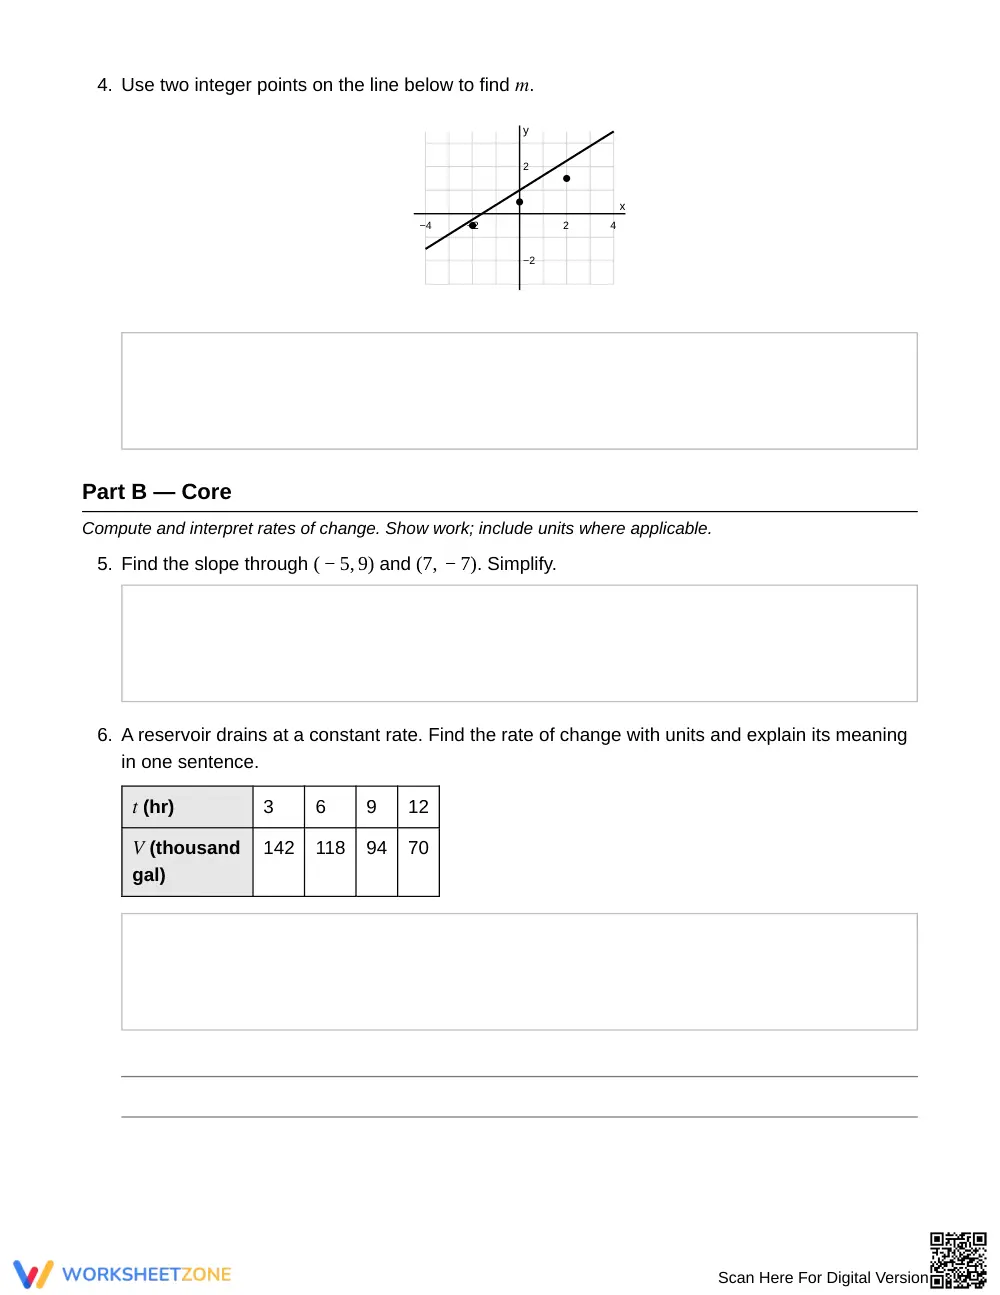
The 5-page resource delivers 16 thoughtfully sequenced problems with a 2-page detailed answer key. It features a top-of-page reference box with the slope formula and line behavior rules, coordinate pairs, function tables, coordinate plane figures, and contextual modeling prompts requiring units and algebraic problem-solving.
Skill Progression
- Guided practice (Part A · 4 tasks): Foundational calculation of slope using the standard formula, identifying line directions, extracting constant rates from data tables, and reading grid points on coordinate graphs.
- Supported practice (Part B · 8 tasks): Intermediate application involving draining reservoirs, cyclist travel graphs, horizontal and vertical zero/undefined slopes, temperature lapse rates, commercial cost comparisons, and solving for missing coordinate variables.
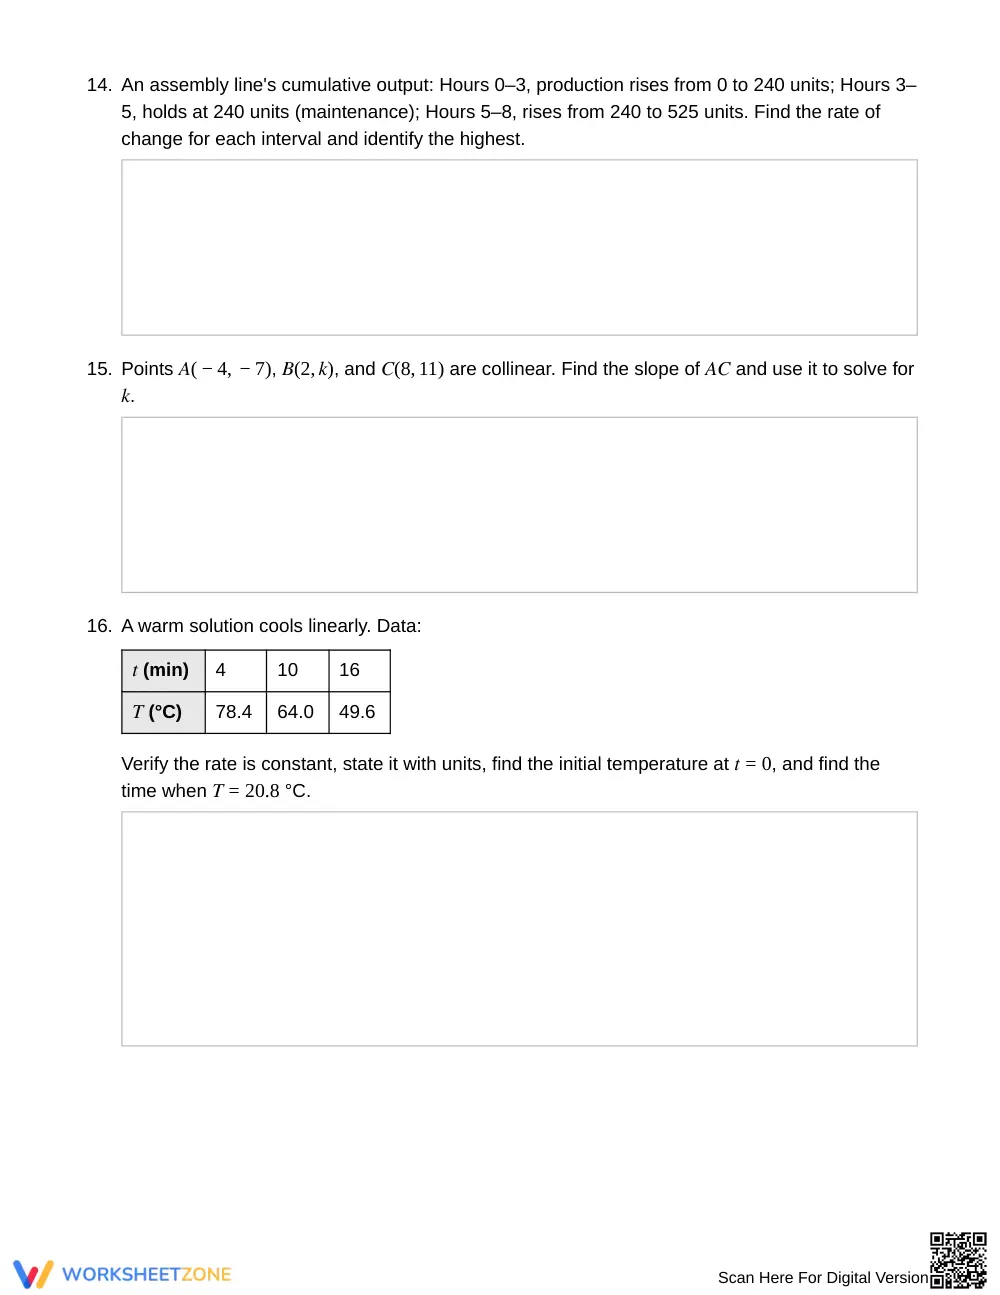
- Independent practice (Part C · 4 tasks): Advanced multi-step challenges featuring unit conversions with ascending drones, multi-interval piecewise rates of change, collinear coordinate proofs, and linear cooling models.
This structured progression follows the gradual release of responsibility model, ensuring students master foundational formula mechanics before tackling non-routine modeling tasks.
Standards Alignment
This worksheet directly targets middle school linear functions and rate of change standards, emphasizing the interpretation of constant rates of change across equations, tables, and graphical representations. The skills practiced support comprehensive curriculum mapping and standards-based progress monitoring.
How to Use It
Use this activity during direct instruction follow-up or as an independent mid-unit checkpoint. For formative assessment, examine student work on Part B to identify whether errors stem from integer operations or misinterpreting delta-y over delta-x. The full set takes 40 to 50 minutes to complete.
Who It's For
This resource is designed for eighth-grade pre-algebra and general math classrooms, as well as early high school Algebra I support. It pairs effectively with a visual anchor chart on slope types or an introductory lesson on proportional relationships.
Structured practice with multiple representations of slope reinforces mathematical reasoning and procedural accuracy. Research by Fisher & Frey (2014) on guided instruction demonstrates that scaffolding problem sets from basic calculation to contextual modeling enables middle school learners to transfer algebraic concepts into independent problem-solving contexts. When students analyze rates of change across coordinate pairs, tabular data, and real-world graphs, they build the foundational competency necessary for high school function analysis and linear modeling. This approach also supports long-term retention by connecting abstract formula mechanics to concrete, meaningful situations. Presenting 16 problems across 3 difficulty levels gives teachers a flexible tool for differentiated instruction, targeted intervention, and formative progress monitoring within a single, cohesive classroom resource.


