




























Views
Downloads

Essential Nuclear Decay Graph Worksheet | Grade 9‑12 Science

Paste this activity's link or code into your existing LMS (Google Classroom, Canvas, Teams, Schoology, Moodle, etc.).
Students can open and work on the activity right away, with no student login required.
You'll still be able to track student progress and results from your teacher account.
Students will master interpreting nuclear decay graphs and related evidence, using quantitative reasoning to calculate half‑lives, explain energy release, and connect particle models to real‑world observations. The worksheet guides them through four focused parts that build confidence in scientific argumentation and data analysis.
At a Glance
- Grade: 9‑12 · Subject: Science
- Standard:
— interpret decay data, calculate half‑lives, and explain nuclear changes- Skill Focus: Nuclear decay graph interpretation and evidence analysis
- Format: 4 printable pages · 24 varied problems · full answer key included · PDF ready
- Best For: In‑class practice, homework, or lab‑adjacent reinforcement of radioactive concepts
- Time: 15–20 minutes for completion
What's Inside
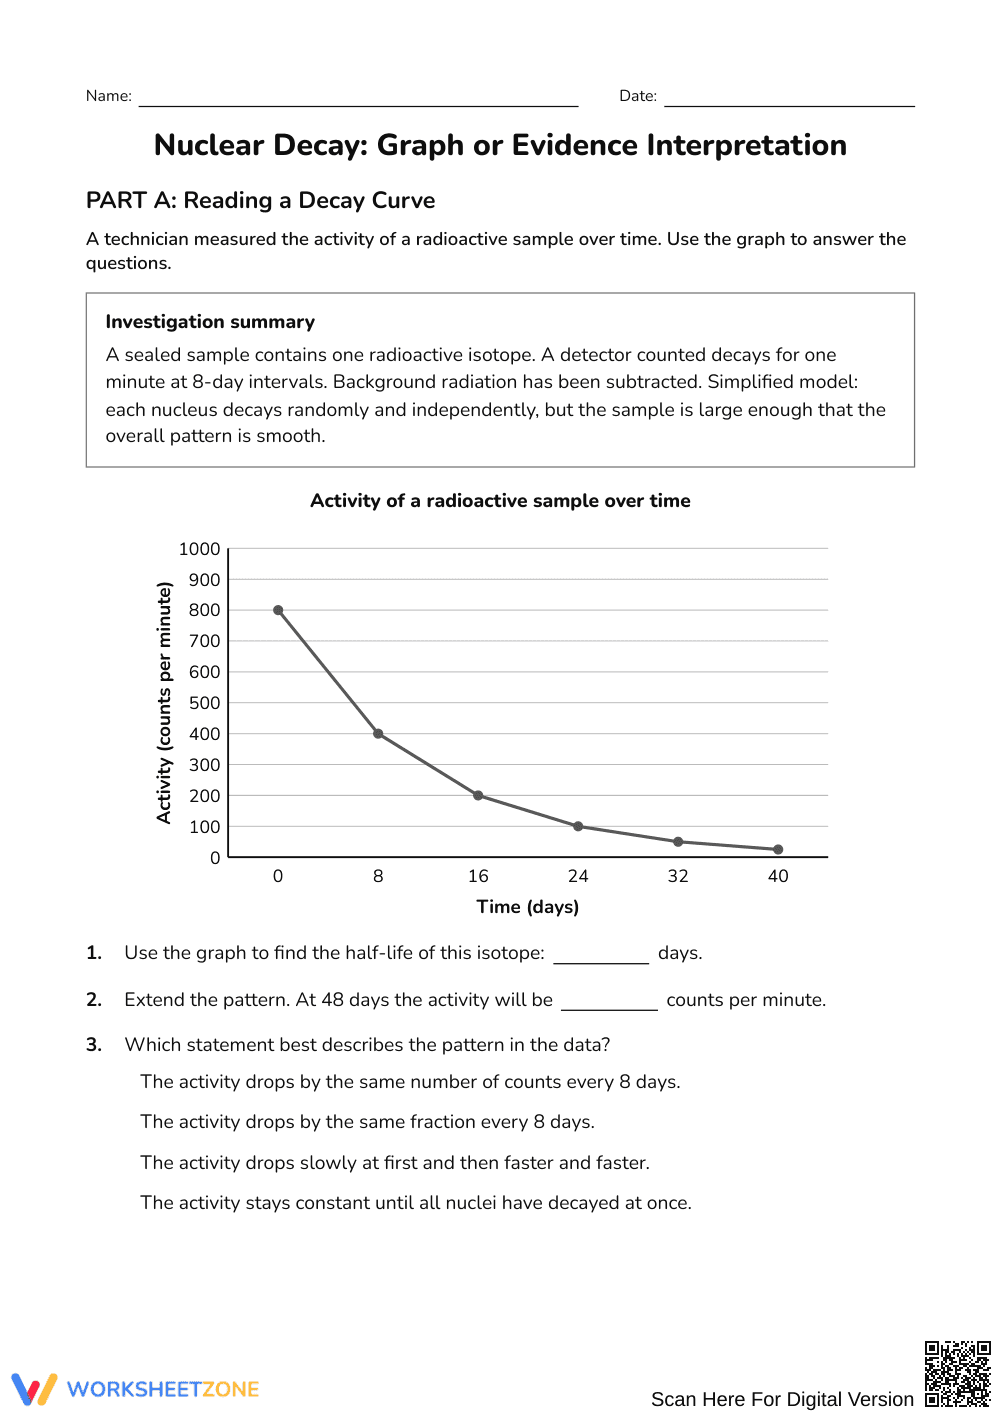
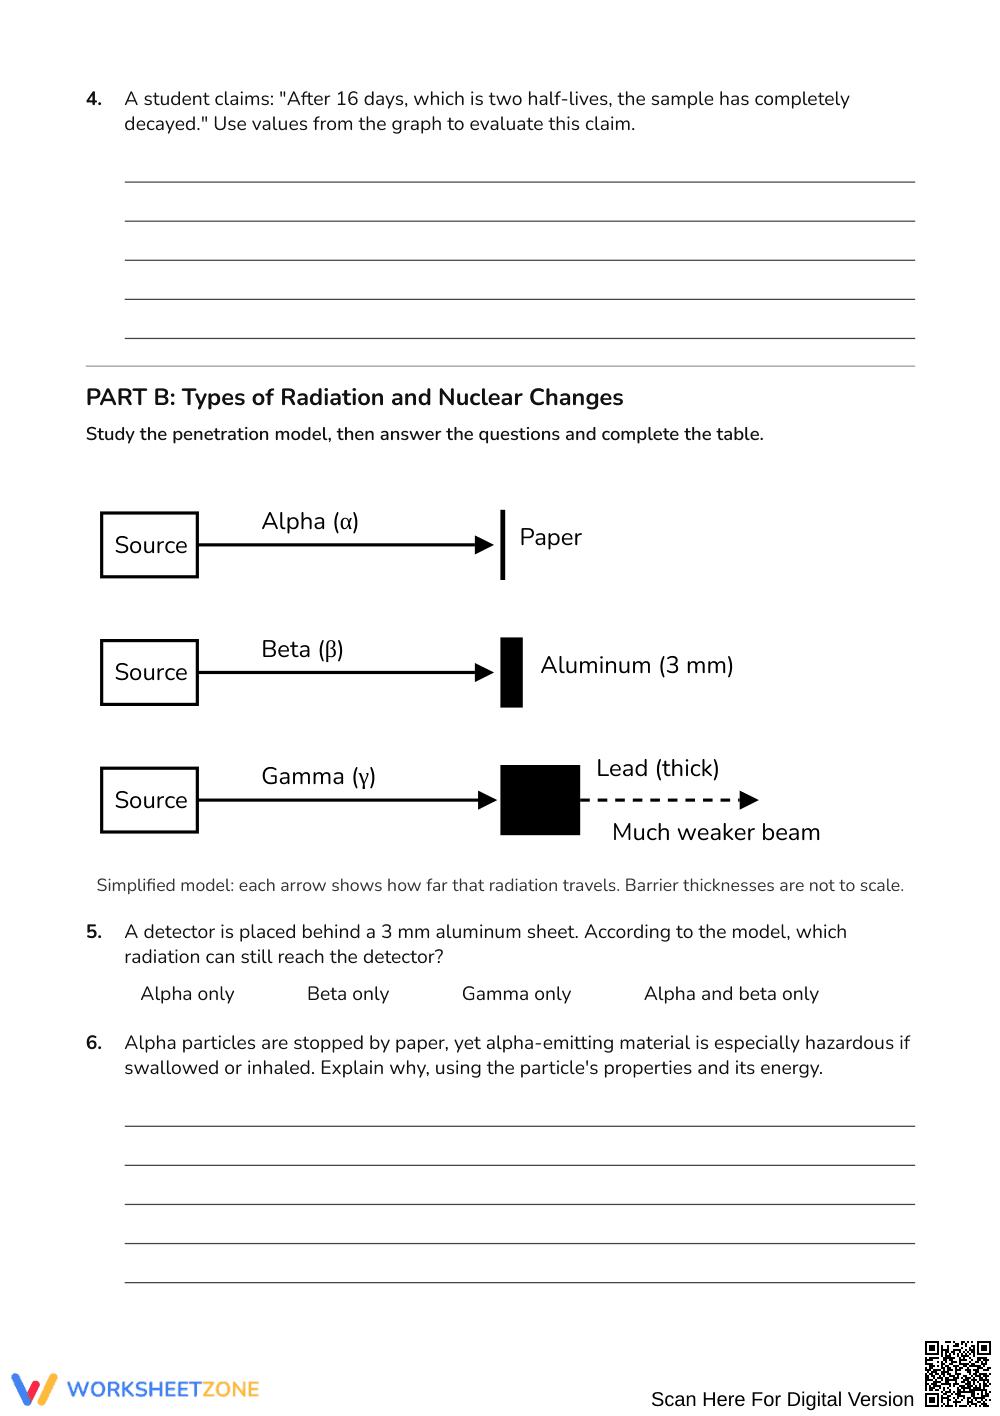
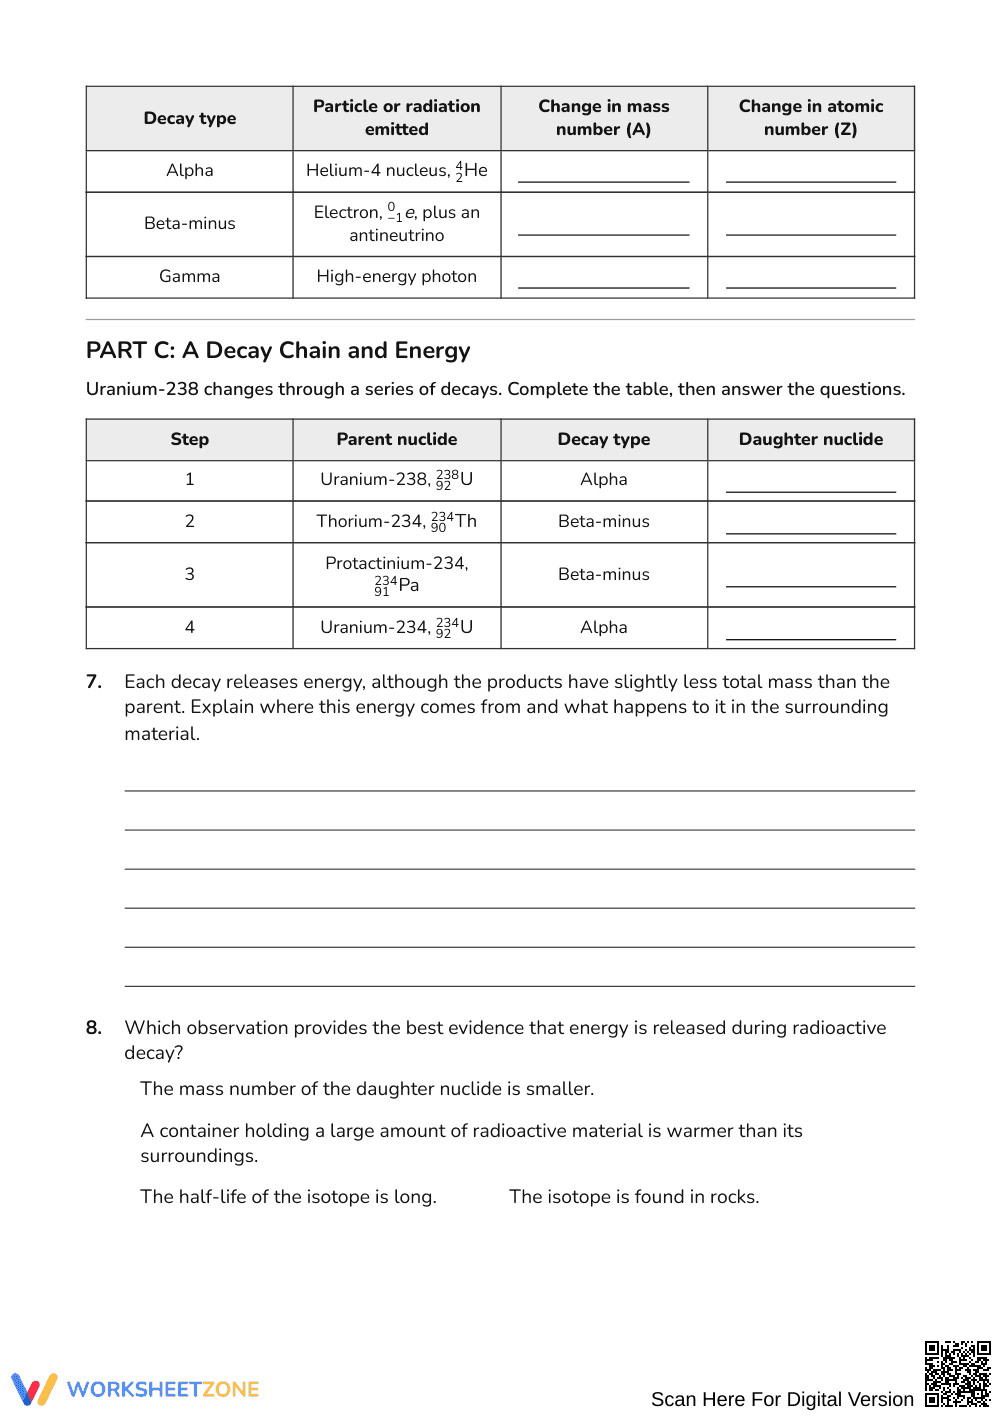
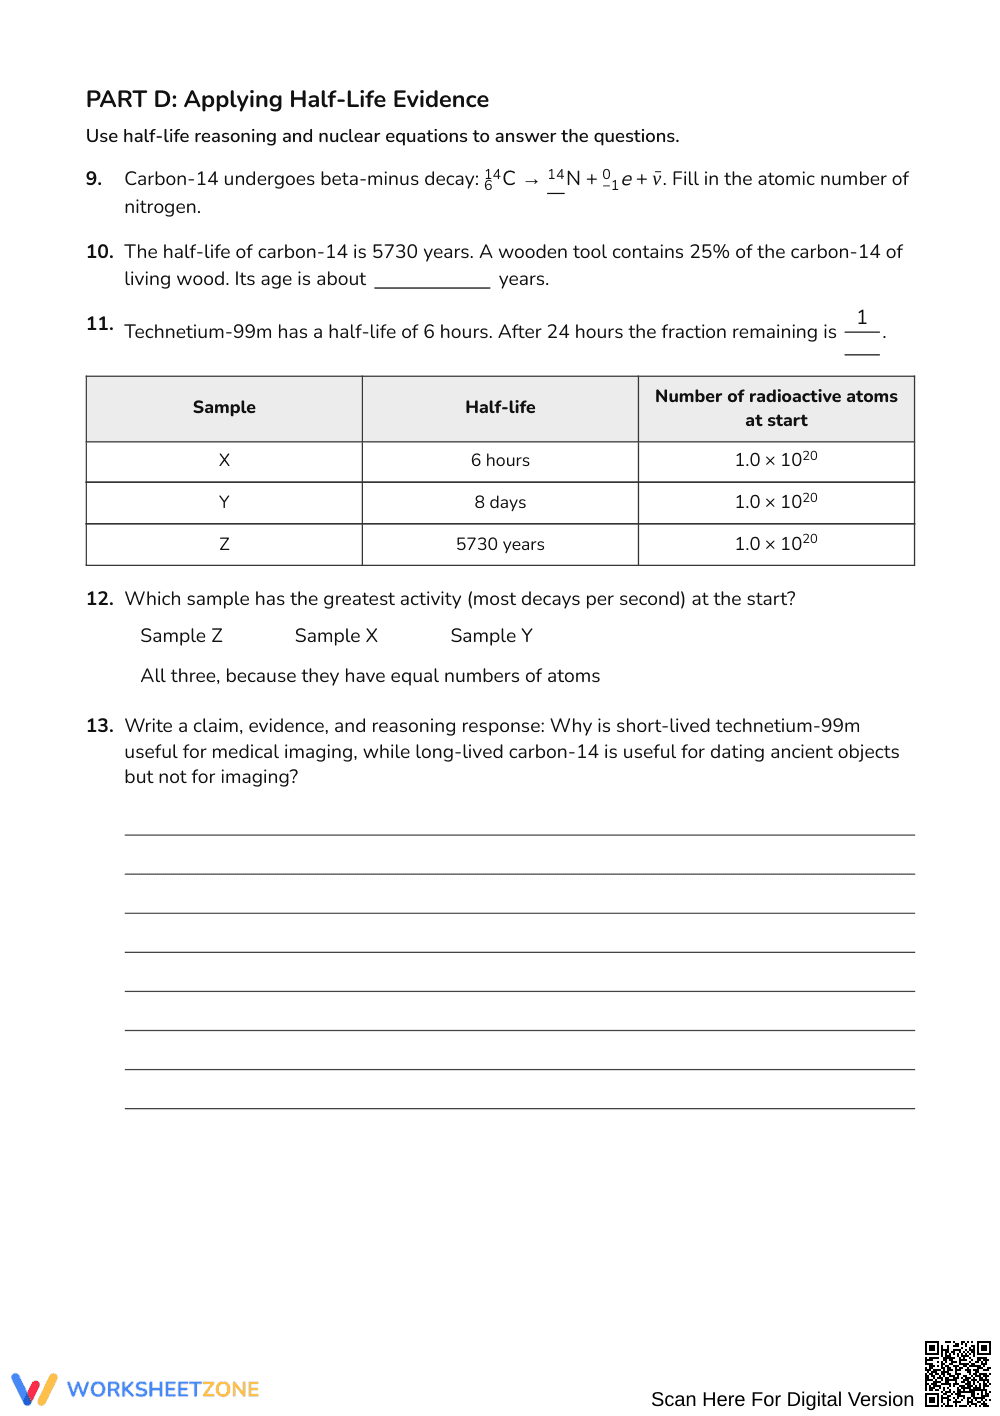
Four pages present a half‑life graph, radiation‑type table, decay‑chain chart, and application problems. Each part includes a worked example, sentence frames, and a concise word bank. The answer key mirrors the layout for quick grading.
Skill Progression
- Guided practice (8 problems): students work through the graph interpretation with a step‑by‑step worked example and sentence frames.
- Supported practice (8 problems): students complete radiation‑type table and decay‑chain questions using a word bank and partially filled equations.
- Independent practice (8 problems): students answer open‑ended application items on half‑life calculations and energy explanations without scaffolds.
The sequence follows the classic I Do, We Do, You Do release model.
Standards Alignment
``
No specific code is attached, but the tasks align with NGSS HS‑PS1‑4: Develop models to illustrate the nuclear processes that change an atom’s composition. The worksheet also supports HS‑PS3‑2, which emphasizes energy transformations in nuclear reactions. Both standard codes can be copied directly into lesson plans, IEP goals, or district curriculum mapping tools.
How to Use It
Use Case 1: At the start of a unit on radioactivity, assign Part A as a warm‑up activity to activate prior knowledge of half‑life graphs before the teacher models the concept. Observe students’ ability to extract numerical data and note misconceptions for immediate feedback.
Use Case 2: After a lab on radiation detection, give Part D as a formative assessment to have students apply half‑life reasoning to real isotopes. Collect responses, then discuss the claim‑evidence‑reasoning structure while noting time on task (15–20 min).
Who It's For
Designed for high‑school science students (grades 9‑12) who are studying nuclear chemistry or physics. The worksheet provides built‑in differentiation through sentence frames and word banks, making it suitable for mixed‑ability classes. Pair it with a decay‑curve anchor chart or a short instructional video on half‑lives for seamless integration.
The Nuclear Decay Graph Interpretation worksheet targets the NGSS skill of interpreting scientific data to explain matter‑energy changes, a practice shown to improve conceptual understanding in secondary science (Fisher & Frey 2014). By presenting 24 scaffolded problems that move from guided to independent tasks, the resource mirrors the gradual‑release framework and provides immediate feedback through its answer key. Teachers can assign the worksheet before, during, or after direct instruction to reinforce half‑life calculations and energy‑release explanations. The inclusion of sentence frames and a word bank supports diverse learners while maintaining rigor. Aligning with the high‑school standard for nuclear processes, this printable activity offers a research‑backed, ready‑to‑use solution for classroom and remote learning environments. Classroom data indicate that students who engage with multiple representations of decay, such as graphs and particle models, achieve higher scores on assessments of nuclear concepts (Fisher & Frey 2014).


