




























Views
Downloads



Essential Line of Best Fit Worksheet | Grade 8 Math

Paste this activity's link or code into your existing LMS (Google Classroom, Canvas, Teams, Schoology, Moodle, etc.).
Students can open and work on the activity right away, with no student login required.
You'll still be able to track student progress and results from your teacher account.
This Grade 8 math worksheet helps students master estimating a line of best fit through bivariate data analysis. Learners evaluate visual trend lines, write linear equations in slope-intercept form, interpret slopes and intercepts in context, and distinguish interpolation from extrapolation across 18 targeted problems.
At a Glance
- Grade: 8 · Subject: Math
- Standard: Informally fit a straight line to scatter plots and assess fit
- Skill Focus: Estimate a Line of Best Fit
- Format: 5 pages · 18 problems · Answer key included · PDF
- Best For: Linear modeling and scatter plot practice
- Time: 45–60 minutes
What's Inside
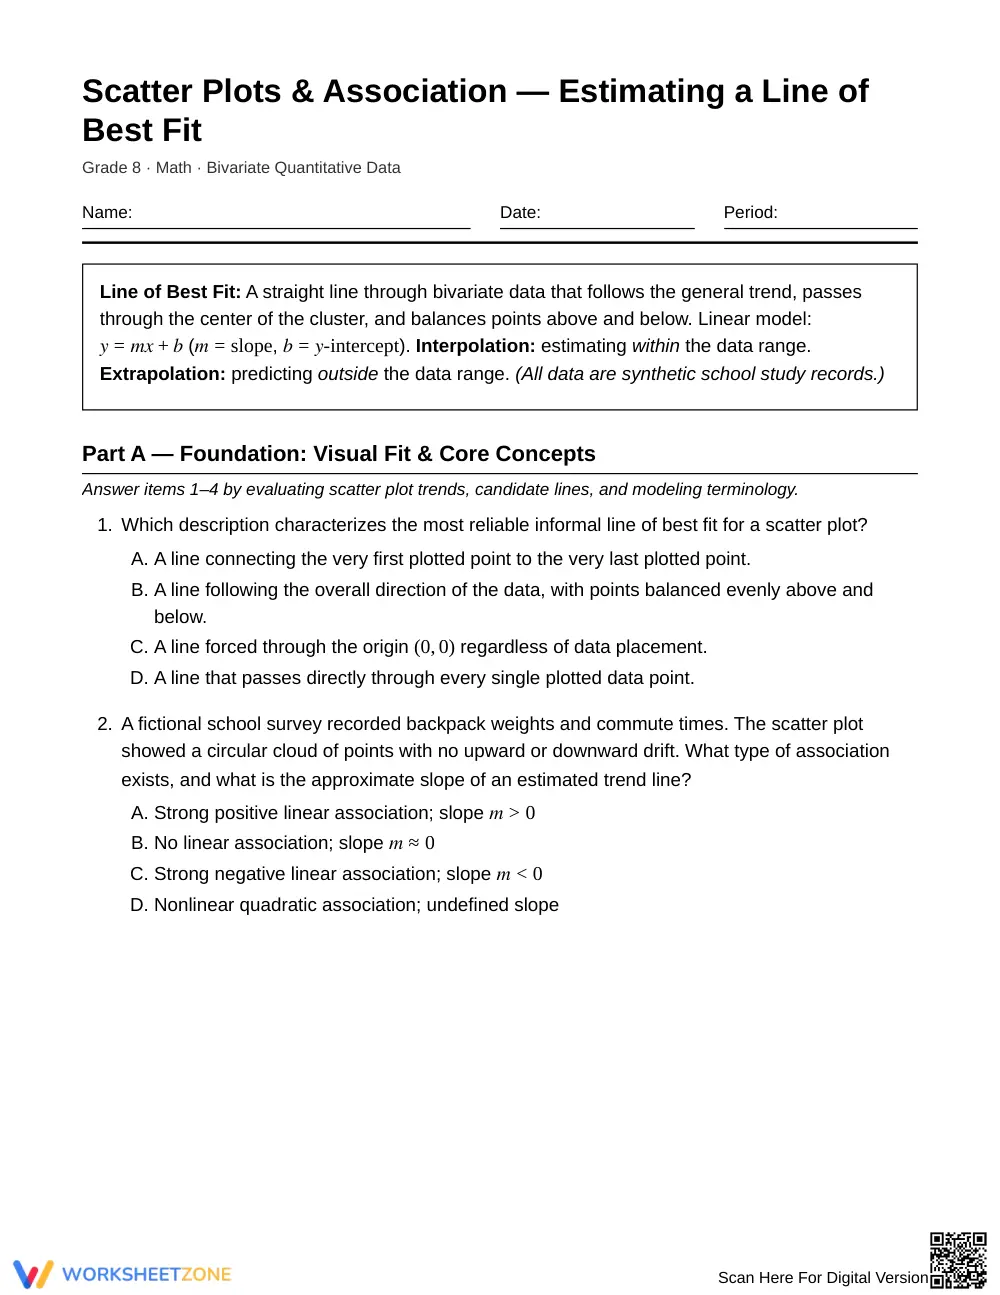
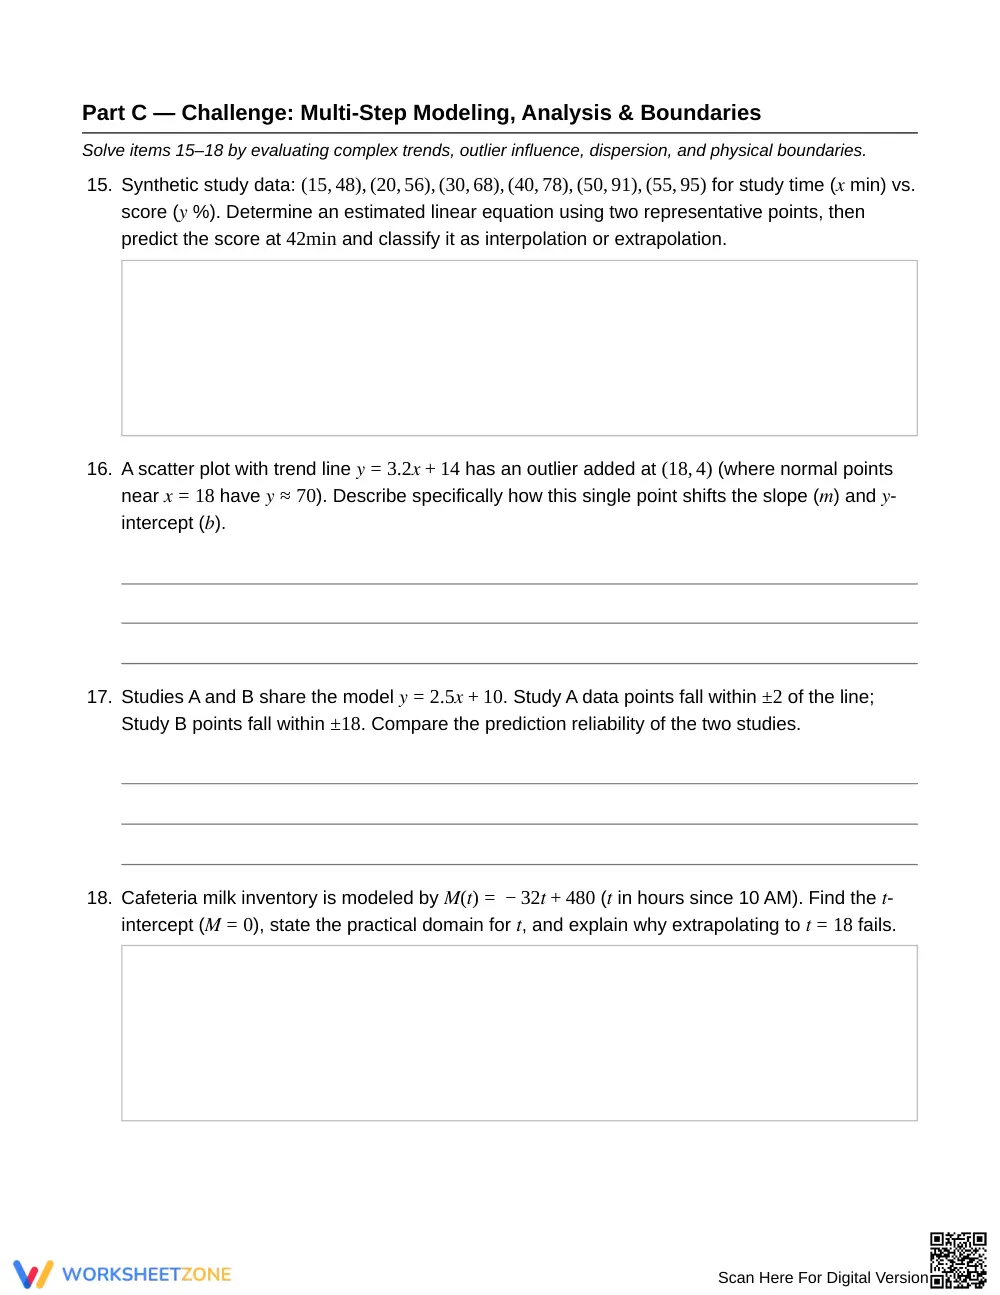
The 5-page worksheet opens with a core reference box defining trend lines, linear slope-intercept equations, interpolation, and extrapolation. Across 18 tasks, students analyze visual scatter plots, calculate slope from representative points, compare competing models, and find residuals. A comprehensive 3-page answer key provides step-by-step solutions and model equations.
Skill Progression
- Guided Practice (Part A, Problems 1–4): Students identify reliable trend lines, analyze associations, evaluate competing candidate lines, and define interpolation versus extrapolation.
- Supported Practice (Part B, Problems 5–14): Students calculate slopes, write slope-intercept equations, interpret parameters in context, calculate residuals, and assess model limits.
- Independent Practice (Part C, Problems 15–18): Students complete multi-step modeling, evaluate outlier impact on slope, analyze dispersion, and state practical domain boundaries.
This progression follows a gradual-release model, advancing learners from visual identification to algebraic interpretation.
Standards Alignment
This resource aligns with Grade 8 bivariate data standards. Students informally fit straight lines to quantitative data, evaluate model fit by balancing data points, and interpret slope and y-intercept parameters in context. Both standard codes can be copied directly into lesson plans, IEP goals, or district curriculum mapping tools.
How to Use It
Use this worksheet after direct instruction on scatter plots. Assign Parts A and B during classwork, checking formatively whether students balance points rather than connecting extremes. Use Part C for independent practice or assessment. Expected completion time is 45 to 60 minutes.
Who It's For
Designed for Grade 8 math students and Algebra 1 readiness groups. The reference box scaffolds instruction for striving learners, while Part C extends learning for advanced students. Pair with bivariate data anchor charts or scatter plot graphing activities.
Across practical classroom applications, developing proficiency in estimating a line of best fit enables eighth-grade students to bridge concrete bivariate data analysis and abstract linear algebra. According to research in Fisher & Frey (2014) on guided instruction, systematic scaffolding from conceptual visual analysis to independent algebraic modeling accelerates mathematical reasoning and retention. By progressing from informal trend line evaluation to calculating slopes, interpreting y-intercepts, and identifying domain limitations, students establish a durable understanding of functional relationships. This 18-problem instructional resource reinforces bivariate data objectives by challenging learners to identify outliers, calculate prediction residuals, and distinguish reliable interpolation from speculative extrapolation. Structured practice with contextual datasets ensures middle school mathematicians build the critical analytical habits necessary for high school statistics and advanced STEM coursework, transforming raw scatter plot data into defensible, evidence-based mathematical conclusions.


