




























Views
Downloads





Essential Feasible Regions Worksheet | Grade 9 Algebra I

Paste this activity's link or code into your existing LMS (Google Classroom, Canvas, Teams, Schoology, Moodle, etc.).
Students can open and work on the activity right away, with no student login required.
You'll still be able to track student progress and results from your teacher account.
This Algebra I worksheet equips Grade 9 students to identify boundary lines, graph half-planes, and determine feasible regions for systems of linear inequalities. Through 16 structured tasks, learners distinguish solid and dashed boundaries, test coordinate points, and interpret multi-constraint intersections, building conceptual fluency and analytical accuracy.
At a Glance
- Grade: 9 · Subject: Algebra I
- Standard:
HSA-REI.D.12— Graph solutions to linear inequalities in two variables as half-planes.- Skill Focus: Boundary, Solution Set, and Feasible Values
- Format: 6 pages · 16 problems · Answer key included · PDF
- Best For: Guided practice and formative checks
- Time: 40–50 minutes
The six-page PDF begins with a core concept review detailing boundary rules and test-point methods. Students complete four multiple-choice items, ten short-application graphing and algebraic conversion tasks, and two extended-response questions. A two-page answer key provides full coordinate solutions, intercepts, and model explanations.
Skill Progression
- Guided practice (Problems 1–4): Four multiple-choice items establish foundational conventions regarding solid versus dashed lines and half-plane shading.
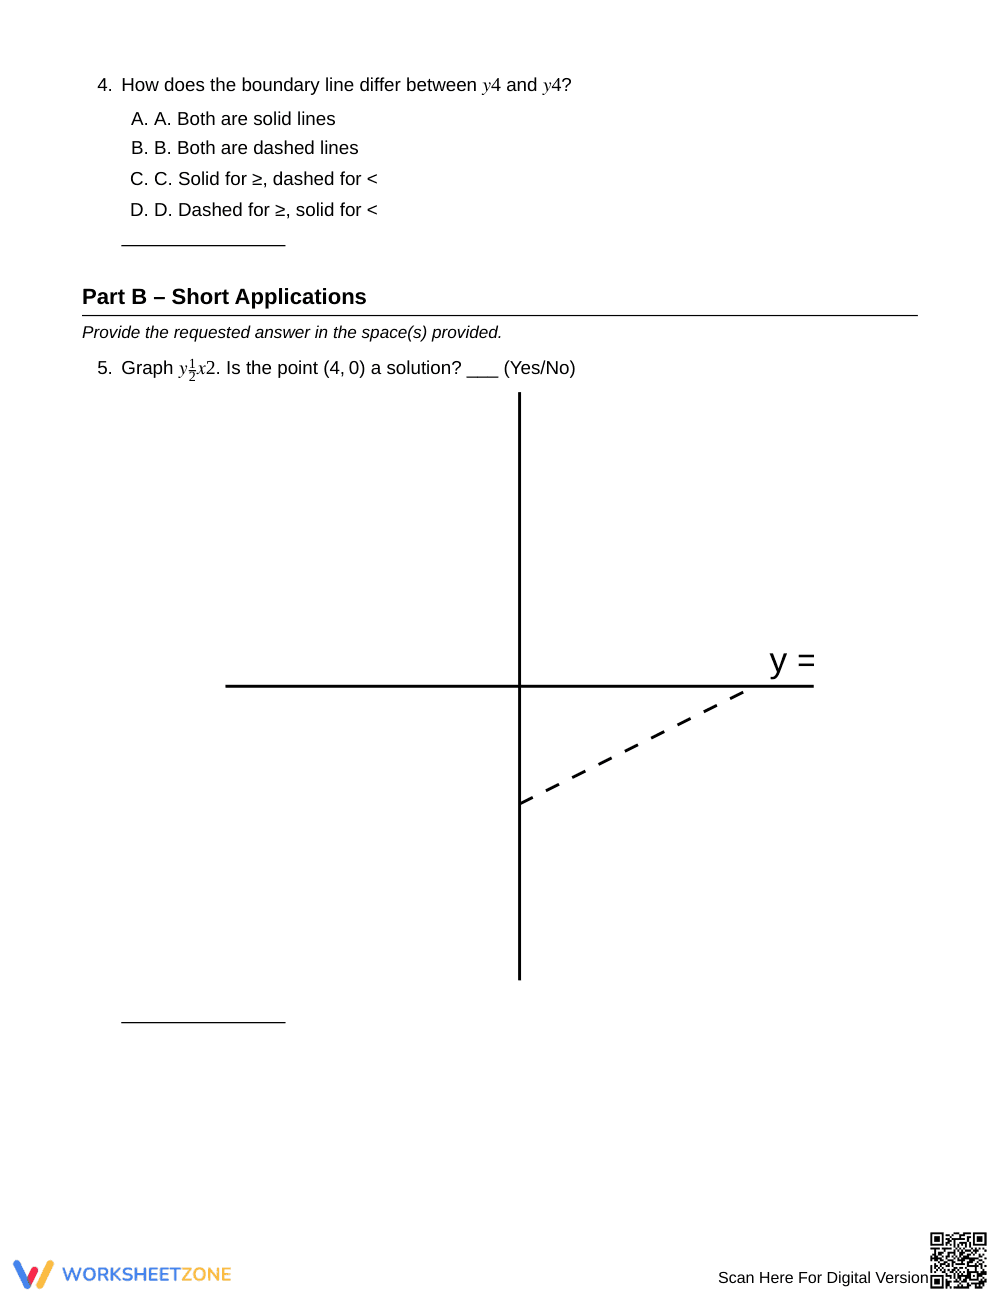
- Supported practice (Problems 5–14): Ten application exercises require students to find intercepts, test coordinate points, and graph systems of inequalities.
- Independent practice (Problems 15–16): Two open-response prompts challenge learners to explain boundary inclusion and vertex optimality in feasible regions.
This sequence follows the gradual-release framework, moving learners from initial recall to independent algebraic analysis.
Standards Alignment
This resource aligns with `HSA-REI.D.12` (graphing linear inequalities in two variables as half-planes and systems as intersections). Supporting standard `HSA-CED.A.3` addresses representing constraints with inequalities and interpreting viable solutions. Both standard codes can be copied directly into lesson plans, IEP goals, or district curriculum mapping tools.
How to Use It
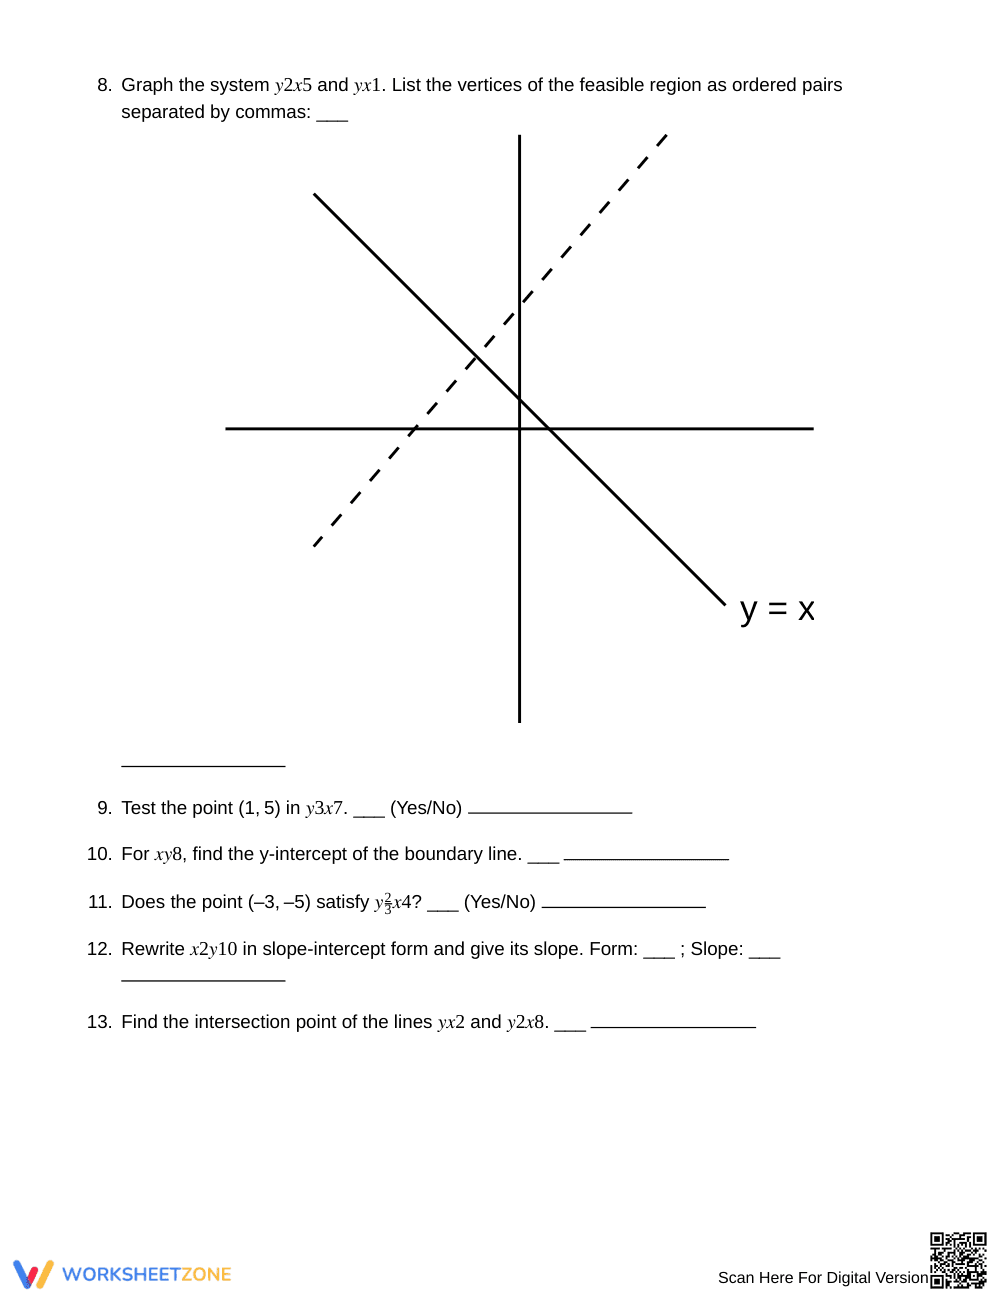
Assign this worksheet following direct instruction on two-variable inequalities, or use it during review stations before unit assessments. For formative assessment, review Problem 8 to confirm whether students test coordinates accurately or rely solely on inequality symbols. Expected completion time is 40 to 50 minutes.
Who It's For
Designed for Grade 9 Algebra I students, this resource also supports upper-grade review. Teachers can differentiate by providing coordinate grid templates or using the conceptual prompts for peer discussion. It pairs naturally with an inequality graphing anchor chart or graphing calculator demonstration.
Mastering linear inequalities under CCSS HSA-REI.D.12 requires students to coordinate algebraic manipulation with visual spatial reasoning to identify boundary lines, half-planes, and feasible regions. According to Fisher & Frey (2014), structured instructional scaffolds that transition from guided conceptual distinctions to complex application and written transfer significantly increase long-term mathematical retention. When high school learners systematically evaluate test coordinates, graph intersecting inequalities, and justify boundary inclusions, they build critical foundational competencies necessary for advanced linear programming and coordinate geometry. This six-page Algebra I worksheet provides 16 purposefully sequenced tasks that bridge procedural computation with conceptual understanding, offering educators reliable diagnostic evidence of student mastery. By requiring explicit justifications for solid versus dashed boundaries, the resource reinforces exact geometric definitions, ensuring high school learners achieve verified proficiency in graphing two-variable inequality solution sets across diverse instructional settings.


