




























Views
Downloads




Essential Data Range Prediction Worksheet | Grade 8 Math

Paste this activity's link or code into your existing LMS (Google Classroom, Canvas, Teams, Schoology, Moodle, etc.).
Students can open and work on the activity right away, with no student login required.
You'll still be able to track student progress and results from your teacher account.
This Grade 8 math worksheet equips students to predict values using linear models and assess whether estimates fall within reasonable data ranges. Across 10 structured problems, learners apply trend lines, differentiate between interpolation and extrapolation, and evaluate real-world domain constraints to build critical data reasoning skills.
At a Glance
- Grade: 8 · Subject: Mathematics (Statistics & Probability)
- Standard: Linear modeling — Predict values and evaluate domain constraints
- Skill Focus: Predict within a reasonable data range
- Format: 5 pages · 10 problems · Answer key included · PDF
- Best For: Guided practice following direct regression instruction
- Time: 40–50 minutes
What's Inside
This 5-page printable packet includes 10 multi-step problems and a 2-page answer key. A foundational review box defines linear equations, interpolation, and extrapolation alongside a complete worked example. Students interpret scatter plot trend lines, calculate residuals, and test domain constraints across authentic contexts.
Skill Progression
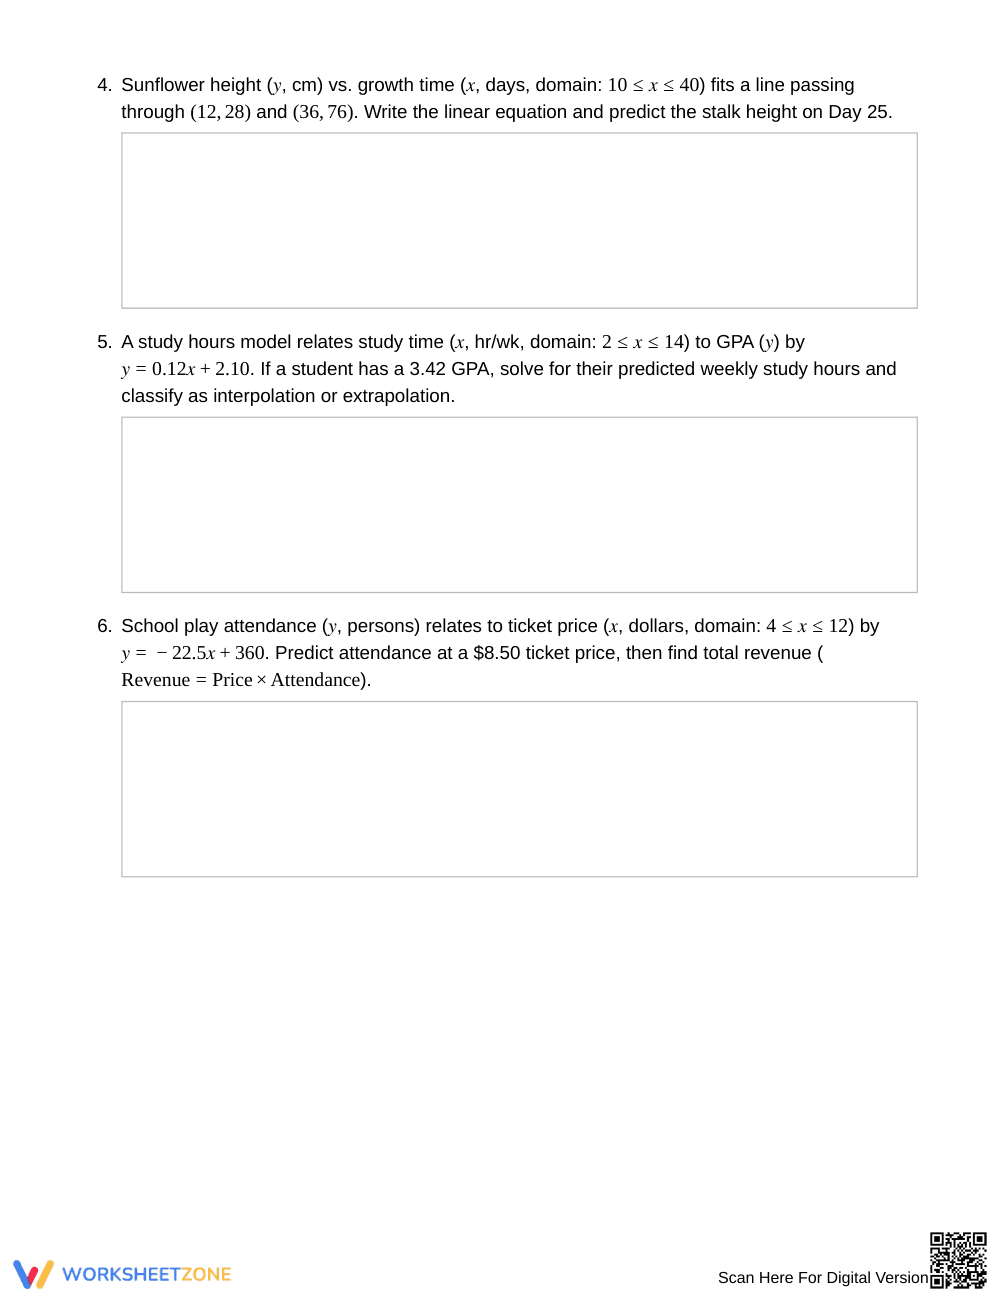
- Guided practice (Part A, Problems 1–2): Students use explicit linear equations and domains to calculate predictions, classifying outcomes as interpolation or extrapolation.
- Supported practice (Part B, Problems 3–8): Learners construct lines of best fit, calculate residuals, and solve inverse equations across 6 multi-step applications.
- Independent practice (Part C, Problems 9–10): Students evaluate operational limits and system constraints, justifying whole-number rounding and identifying failure conditions.
This sequence embodies gradual-release instruction, transitioning students smoothly from scaffolded evaluation to rigorous independent reasoning.
Standards Alignment
This worksheet aligns with eighth-grade statistics objectives requiring students to solve linear equation problems fitted to bivariate scatter plots. A supporting standard involves interpreting rate of change and intercepts in context. Both standard codes can be copied directly into lesson plans, IEP goals, or district curriculum mapping tools.
How to Use It
Assign this worksheet after direct instruction on linear association. It serves well as structured partner practice or an independent checkpoint. Formatively check whether students verify domain limits in Part A before calculating values. The 10 problems take 40 to 50 minutes to complete.
Who It's For
This resource supports Grade 8 math students developing bivariate data proficiency. Explicit domain intervals scaffold struggling learners, while constraint tasks challenge advanced students. Pair this activity with an anchor chart comparing interpolation and extrapolation to solidify foundational terminology.
Grade 8 linear modeling instruction focuses on predicting within a reasonable data range to cultivate authentic statistical literacy and critical data interpretation skills. Working through 10 contextual problems using trend lines and domain parameters, students learn to distinguish between reliable interpolation and risky extrapolation. According to Fisher & Frey (2014), structured learning progressions that move students from supported equation evaluation to independent constraint analysis significantly enhance conceptual retention and problem-solving transfer. This 5-page worksheet provides targeted practice where middle school mathematicians examine bivariate associations, derive lines of best fit, calculate residuals, and evaluate real-world operating limits. By learning to critically question whether an estimate falls within observed evidence boundaries rather than relying on automatic mechanical computation, students develop the mathematical habits necessary for high school algebra, advanced statistics, and scientific data analysis across STEM disciplines.


