






























Essential Data Decisions Worksheet | Grade 12 Statistics

Paste this activity's link or code into your existing LMS (Google Classroom, Canvas, Teams, Schoology, Moodle, etc.).
Students can open and work on the activity right away, with no student login required.
You'll still be able to track student progress and results from your teacher account.
This advanced statistics worksheet trains students to evaluate distribution shape, detect outliers using the 1.5 × IQR rule, and select appropriate numerical summaries for real-world decision-making. Students analyze concrete datasets to justify when to report mean and standard deviation versus resistant measures like median and interquartile range across high-stakes industrial, medical, and financial contexts.
At a Glance
- Grade: 12 · Subject: Statistics
- Standard:
HSS.ID.A.2— Select appropriate summary statistics to compare shape, center, and spread- Skill Focus: Selecting Numerical Summaries for Data Decisions
- Format: 5 pages · 10 problems · Answer key included · PDF
- Best For: Quantitative data analysis unit assessment
- Time: 45–60 minutes
What's Inside
This 5-page printable activity features 10 multi-part analytical problems arranged in a clear progression. It opens with an explicit reference box defining resistant measures and the 1.5 × IQR outlier fence rule, followed by a complete worked model demonstrating transit delay analysis. The worksheet includes structured data tables, comparative distribution metrics, and an exhaustive 3-page step-by-step answer key.
Skill Progression
- Guided Practice: Tasks 1–2 require students to compute five-number summaries, determine IQR, evaluate outliers with explicit formulas, and justify center and spread choices for healthcare and pharmaceutical datasets.
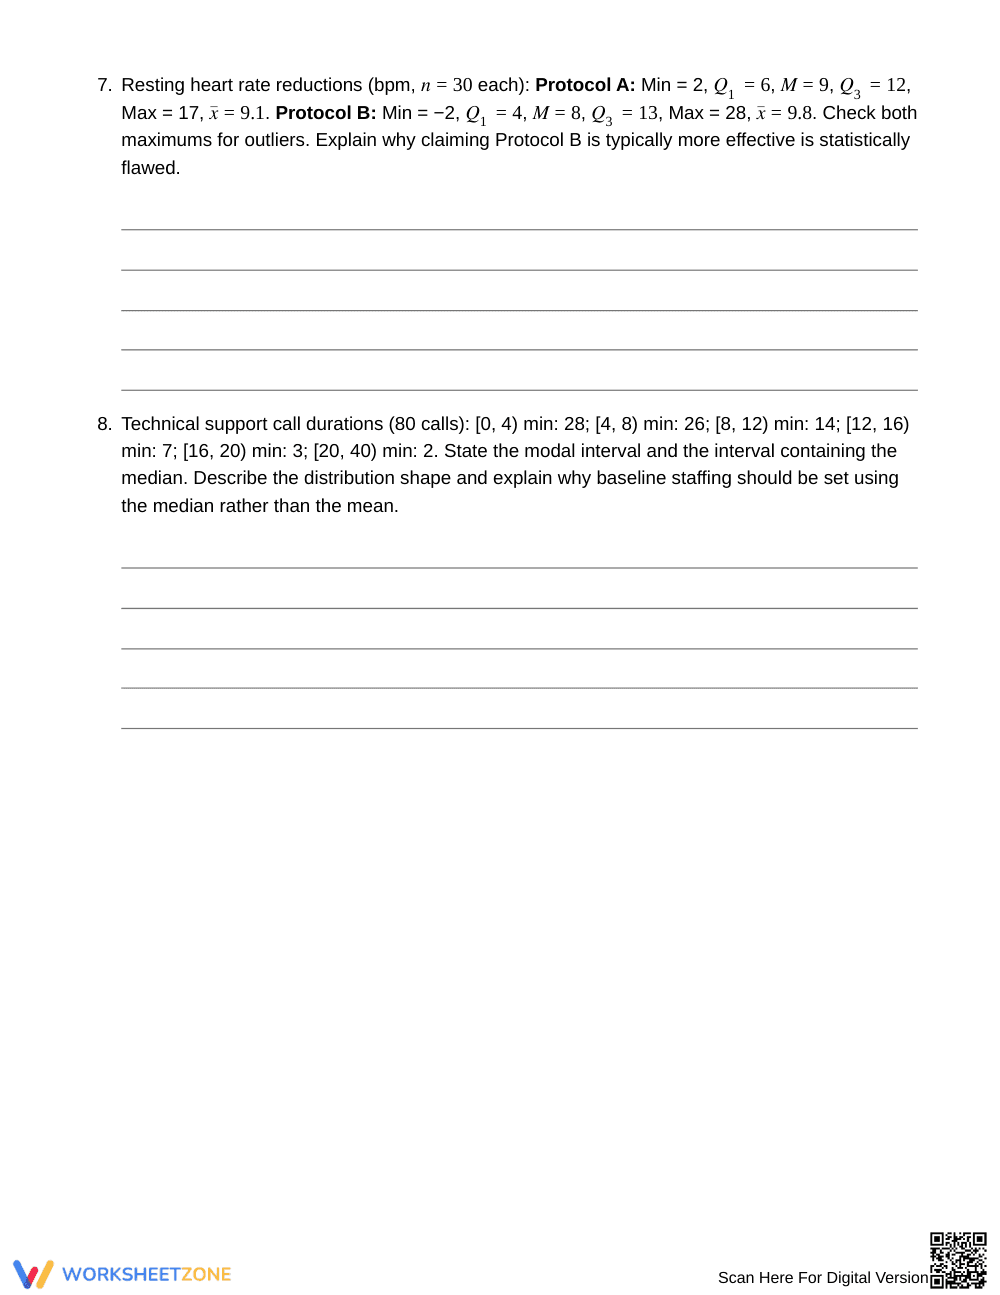
- Supported Practice: Tasks 3–8 present multi-step comparative scenarios (banking, housing, manufacturing, and tech compensation) where students contrast skewed and symmetric distributions across two groups.
- Independent Practice: Tasks 9–10 challenge students with constraint-driven decision models involving environmental regulatory thresholds and freight delivery delay penalties.
This structured progression follows the gradual-release model, shifting students from guided statistical computation to independent data evaluation.
Standards Alignment
This resource aligns with high school statistics standard HSS.ID.A.2: Use statistics appropriate to the shape of the data distribution to compare center and spread of two or more different data sets. It also supports data interpretation standards focusing on evaluating the effect of extreme data points. Both standard codes can be copied directly into lesson plans, IEP goals, or district curriculum mapping tools.
How to Use It
Deploy this worksheet after direct instruction on quantitative summaries and skewness. In an initial 50-minute lab period, have students work in pairs on Part B to debate which measure best reflects typical performance. For formative assessment, check whether students default to the arithmetic mean or properly calculate the 1.5 × IQR fences when distributions contain extreme skew.
Who It's For
This worksheet is designed for Grade 12 AP Statistics or introductory college statistics students who need to move beyond rote computation into evidence-based data critique. Pair this worksheet directly with a boxplot construction lesson or an exploratory data analysis lab.
Selecting appropriate numerical summaries forms the cornerstone of quantitative literacy and applied data interpretation. According to Fisher & Frey (2014), structured problem sets that transition from explicit worked modeling to complex comparative evaluation significantly improve conceptual transfer in STEM disciplines. Under standard HSS.ID.A.2, advanced high school learners must evaluate how distribution skewness and extreme values distort non-resistant metrics such as the sample mean and standard deviation. By challenging students to calculate five-number summaries, establish 1.5 × IQR fences, and evaluate real-world constraints across 10 multi-step problems, this 5-page instructional resource ensures students master resistant summary statistics. Learners build verifiable analytical skills required to defend data-driven recommendations in academic research, public policy analysis, quality control, and postsecondary statistical coursework.


