




























Views
Downloads


Distance-Time Graphs Worksheet | Grade 9 Essential

Paste this activity's link or code into your existing LMS (Google Classroom, Canvas, Teams, Schoology, Moodle, etc.).
Students can open and work on the activity right away, with no student login required.
You'll still be able to track student progress and results from your teacher account.
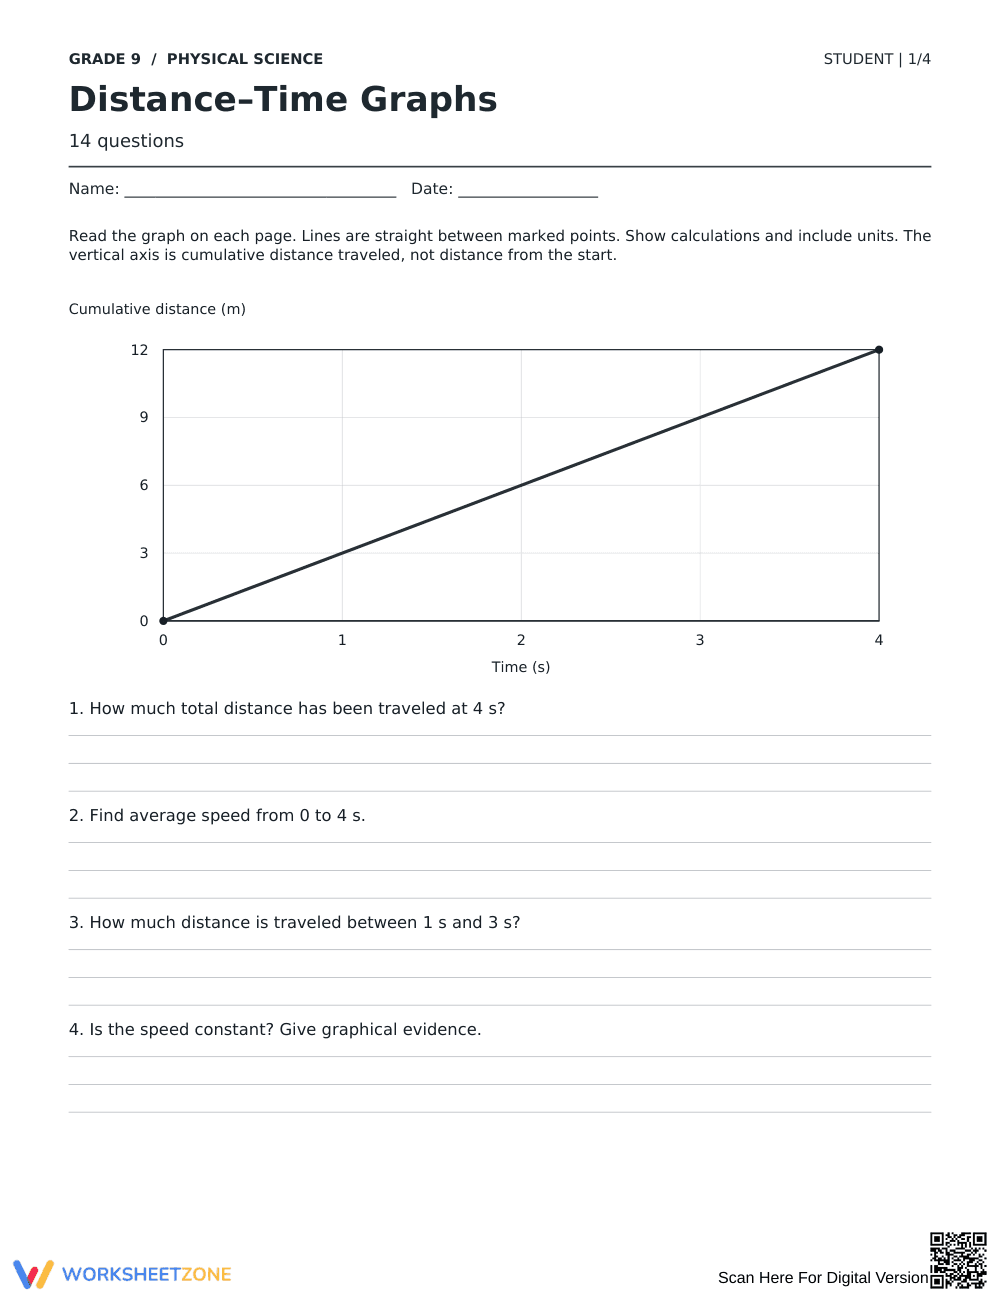
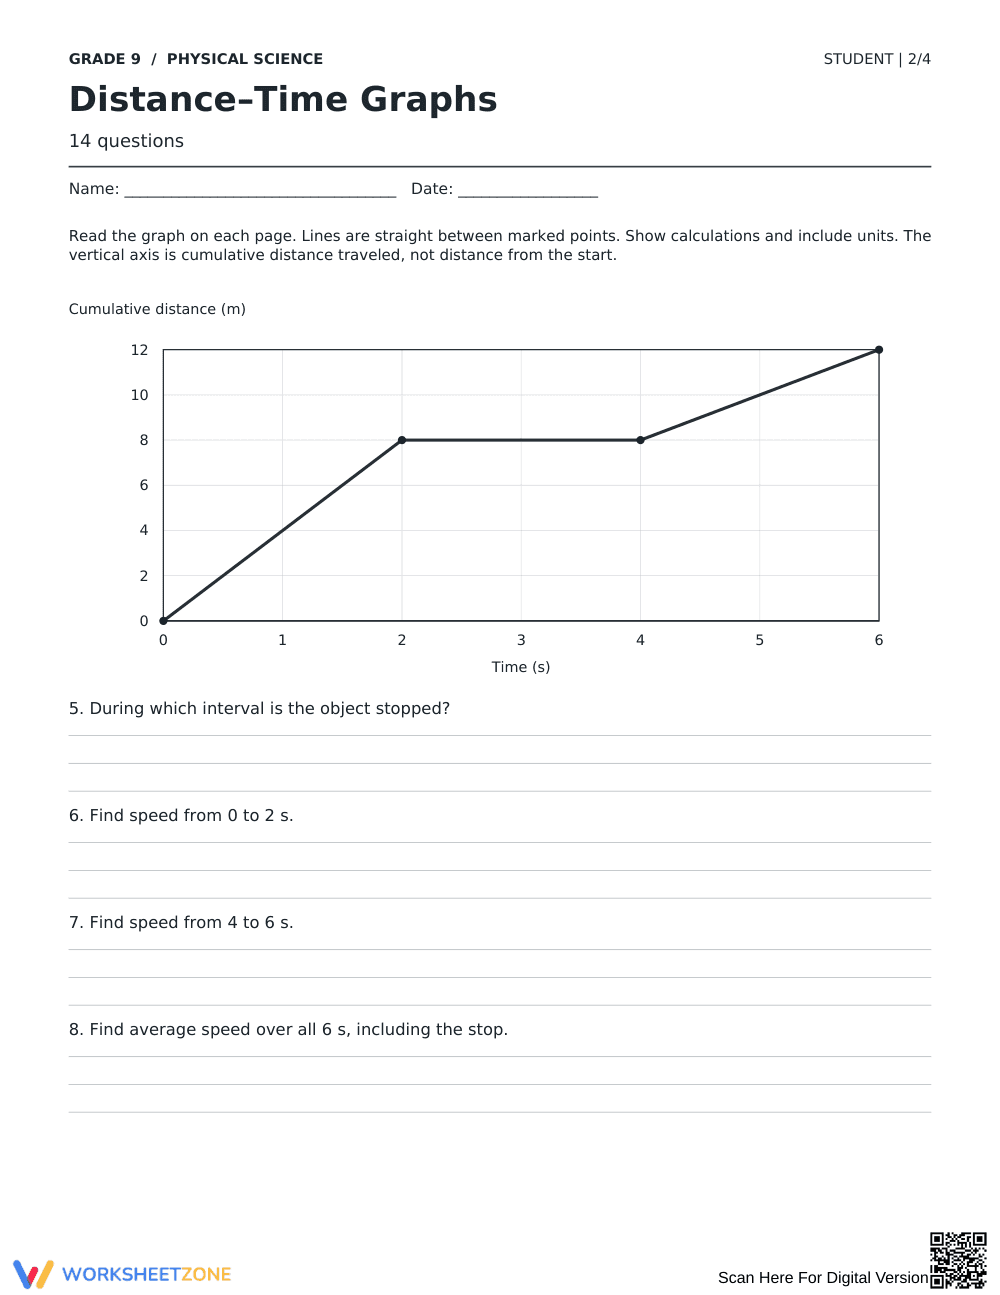
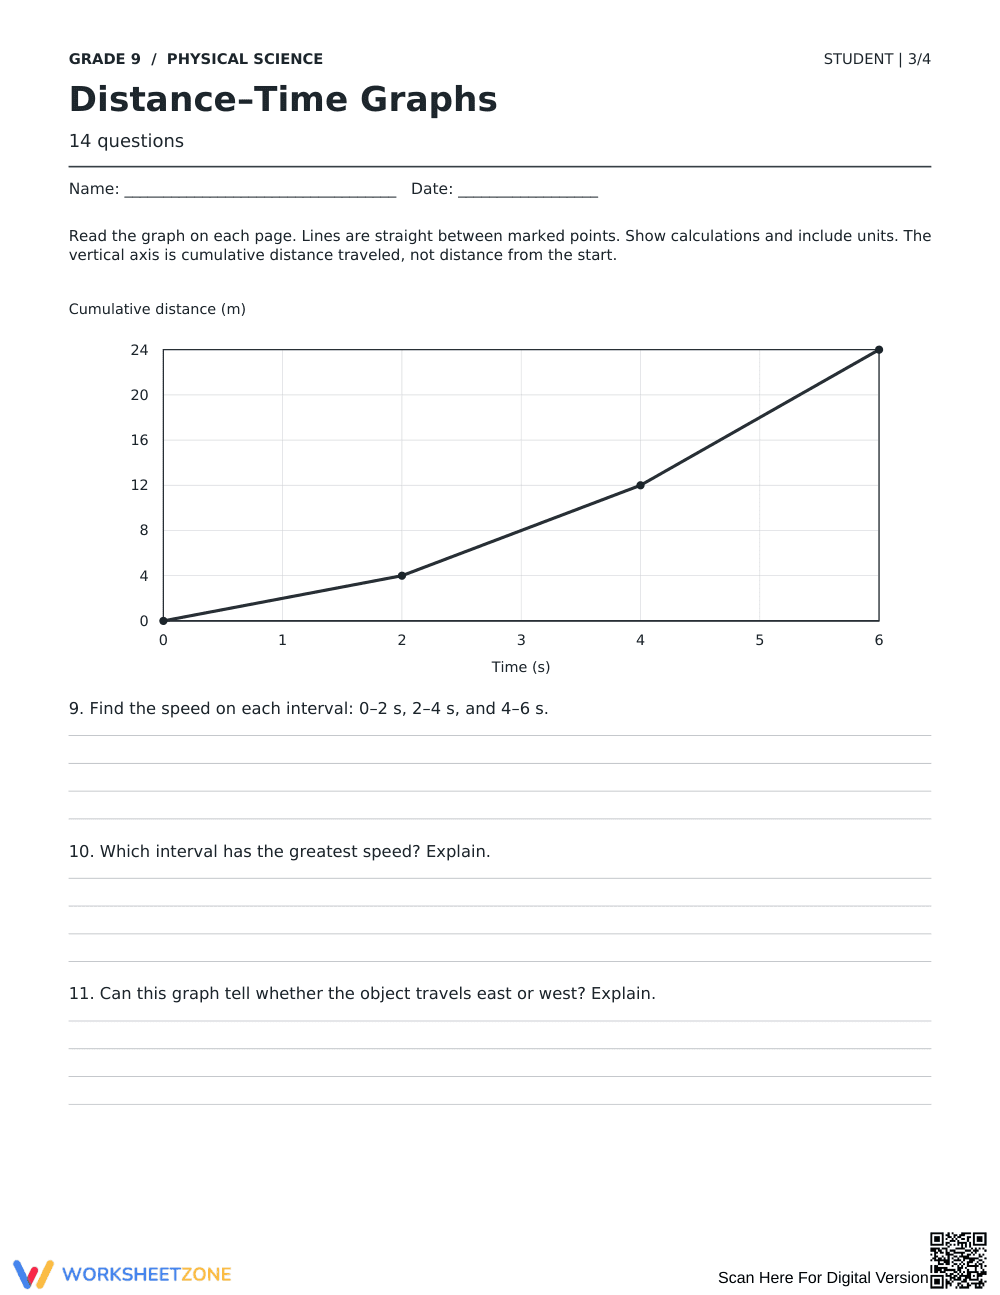
This distance-time graphs worksheet equips Grade 9 physical science students with the quantitative skills needed to analyze linear motion. Learners extract data from four distinct motion plots, compute interval and average speeds using slope calculations, and justify physical states such as constant speed and stationary rest with direct graphical evidence.
At a Glance
- Grade: 9 · Subject: Science
- Standard:
HS-PS2-1— Analyze motion data to determine relationships between distance, time, and speed- Skill Focus: Interpreting distance-time graphs and rate calculations
- Format: 4 pages · 14 problems · Answer key included · PDF
- Best For: High school physics introductory kinematics practice
- Time: 25–40 minutes
What's Inside
The 4-page student packet features 14 sequential, open-response analytical questions structured around four cumulative distance graphs. Students interpret constant velocity, zero velocity across horizontal segments, multi-stage journeys with varying rates, and cumulative distance properties. A complete 2-page answer key provides step-by-step arithmetic, units, and clear model explanations for each item.
Skill Progression
- Guided practice (Problems 1–4): Students read a single uniform-speed graph to identify total distance, solve for average speed over 4 seconds, and cite graphical slope to establish constant rate of motion.
- Supported practice (Problems 5–8): Learners interpret a multi-segment graph containing a stationary interval, contrasting active movement with resting plateaus while computing segmented rates.
- Independent practice (Problems 9–14): Students tackle changing positive rates across multiple time intervals, compare slopes, evaluate vector versus scalar distinctions, and critique a common student misconception regarding trip averaging.
This structure reflects the gradual release model, guiding learners smoothly from basic slope extraction to rigorous conceptual evaluation.
Standards Alignment
Primary alignment targets `HS-PS2-1`: Analyze data to support the claim that Newton's second law of motion describes the mathematical relationship among the net force on a macroscopic object, its mass, and its acceleration. This resource builds foundational kinematics skills by reinforcing the mathematical definition of speed as the slope of position-time curves. As a supporting standard, `MS-PS2-2` reinforces investigation of an object's motion through quantitative change. Both standard codes can be copied directly into lesson plans, IEP goals, or district curriculum mapping tools.
How to Use It
Deploy this resource during direct instruction as guided class practice immediately after defining speed and slope, or assign it after direct instruction for independent consolidation. When circulating during classwork, observe whether students include elapsed time during rest stops when computing total average speed in Problem 13; this common oversight highlights whether students understand total trip duration versus active movement intervals. Expected completion time is 25 to 40 minutes.
Who It's For
This activity supports Grade 9 physical science and introductory physics classrooms. It suits general education students learning linear kinematics and provides scaffolded coordinate grids beneficial for visual learners. Pair this printable with a real-time motion detector lab or an introductory kinematics anchor chart.
According to Fisher & Frey (2014), purposeful skill acquisition relies on guided instruction that transitions into structured analytical problem sets, cementing abstract mathematical models before advanced conceptual synthesis. This Grade 9 worksheet supports standard HS-PS2-1 by ensuring students develop fluency in translating visual graph slopes into numerical speed values and physical descriptions of motion. By targeting the mechanics of cumulative distance across 14 scaffolded items, learners gain the procedural and conceptual mastery required for subsequent investigations into velocity vectors, acceleration rates, and Newtonian mechanics.


