



























Complete Standard Deviation Worksheet | Grade 12 Statistics

Paste this activity's link or code into your existing LMS (Google Classroom, Canvas, Teams, Schoology, Moodle, etc.).
Students can open and work on the activity right away, with no student login required.
You'll still be able to track student progress and results from your teacher account.
Master quantitative data analysis with this comprehensive standard deviation practice worksheet. High school students calculate sample variance, estimate spread from grouped data, and interpret standard deviation across real-world contexts. Learners compare distributions, assess outlier sensitivity, and justify statistical measures using distribution shape.
At a Glance
- Grade: 12 · Subject: Statistics
- Standard:
HSS-ID.A.2— Compare center and spread of different data sets using appropriate statistics- Skill Focus: Calculate and Interpret Standard Deviation
- Format: 5 pages · 12 problems · Answer key included · PDF
- Best For: AP Statistics and high school data units
- Time: 45–60 minutes
What's Inside
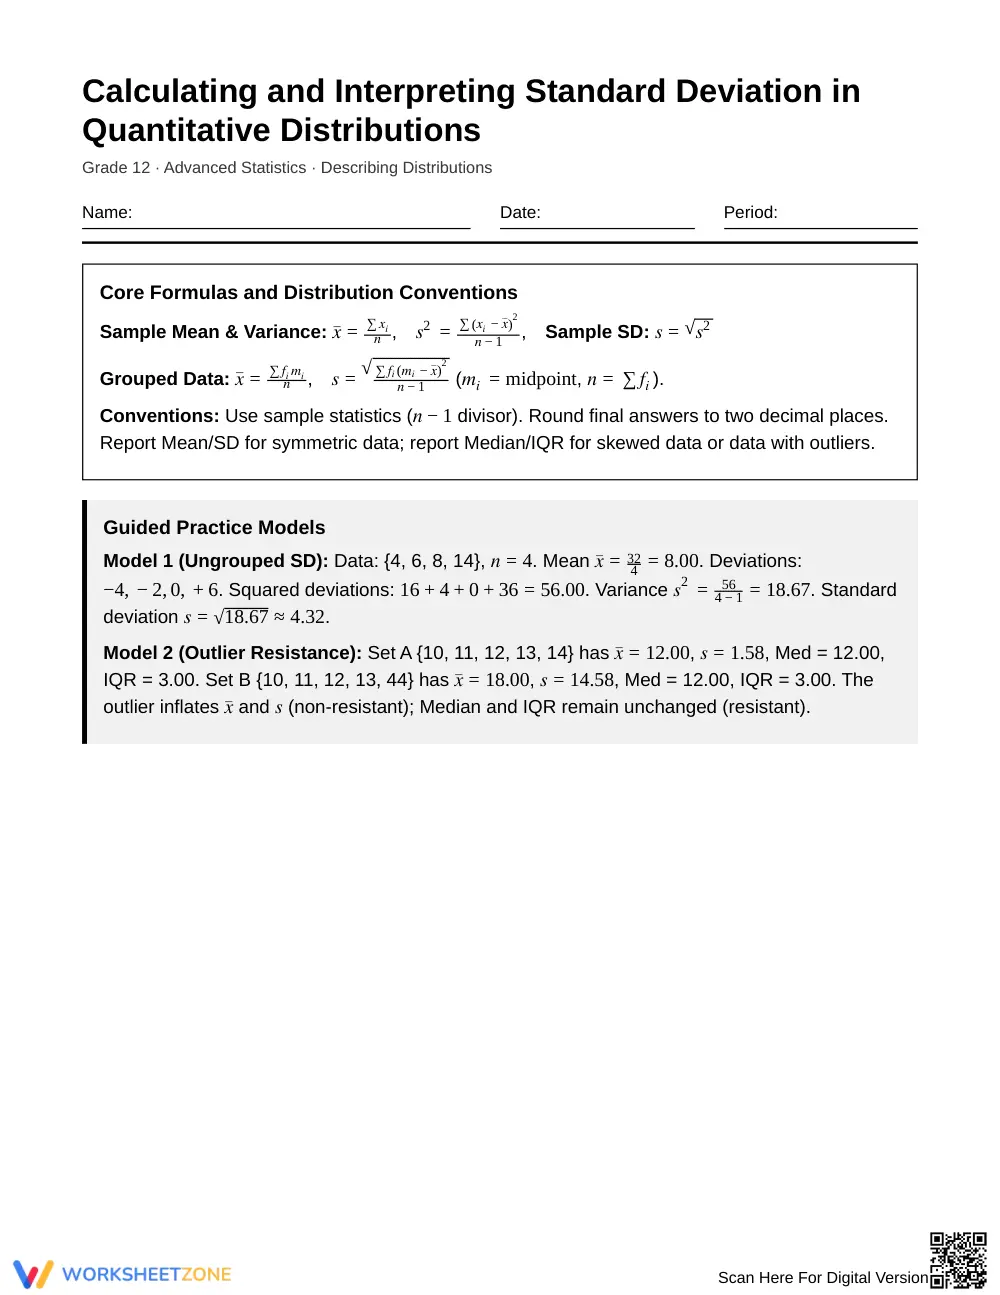
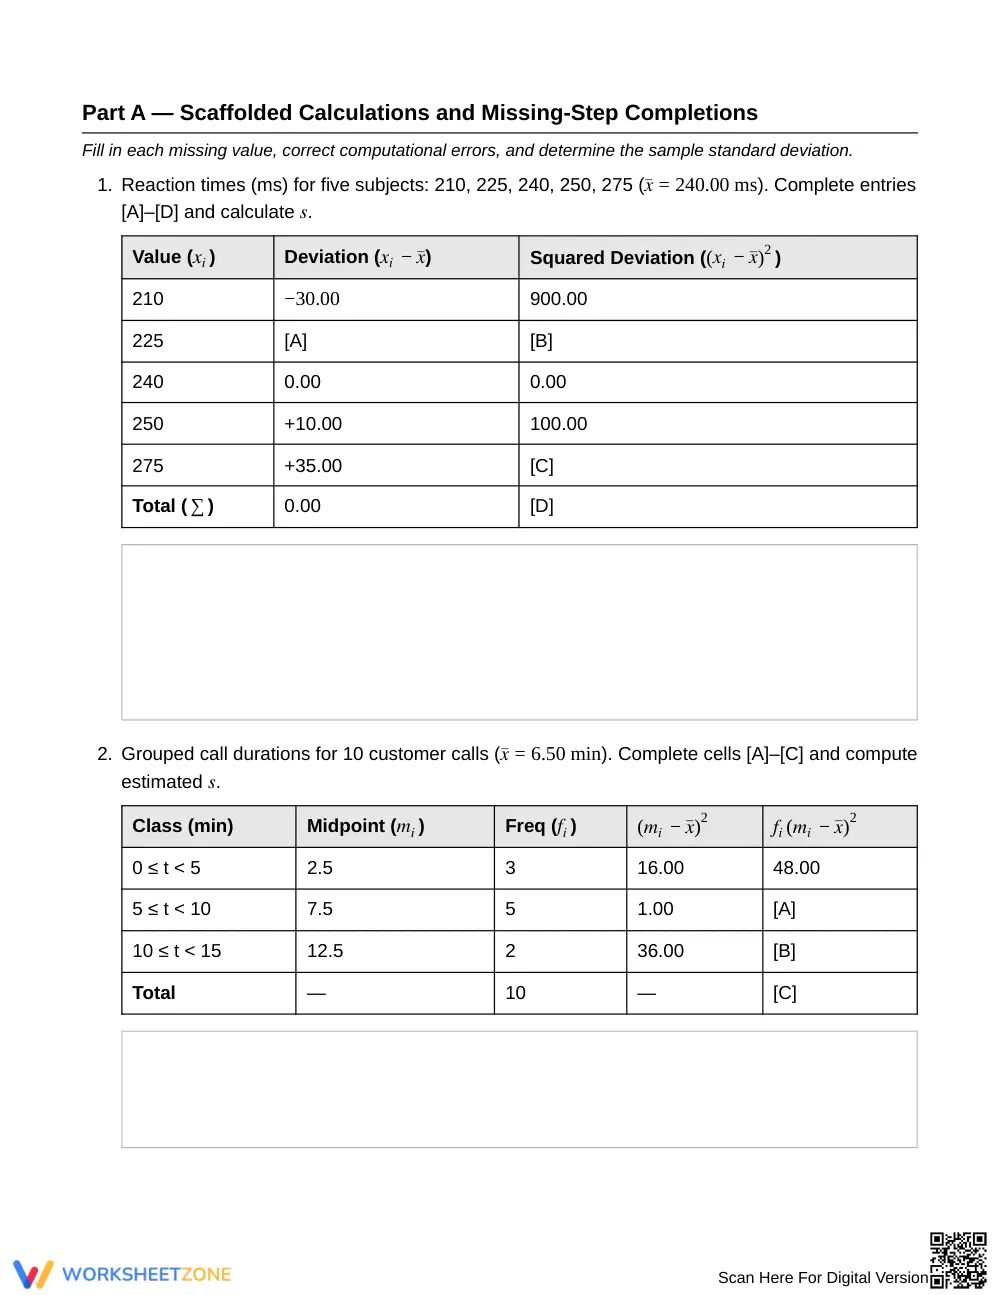
This 5-page worksheet includes 12 multi-step problems and a 3-page complete answer key. Students utilize a reference formula box for ungrouped and grouped calculations, structured deviation tables with missing steps, worked calculation models, and contextual scenarios requiring distribution comparisons.
Skill Progression
- Guided Practice (Part A, Problems 1–4): Scaffolds computation using structured calculation tables, grouped data midpoint formulas, missing value deduction, and error analysis.
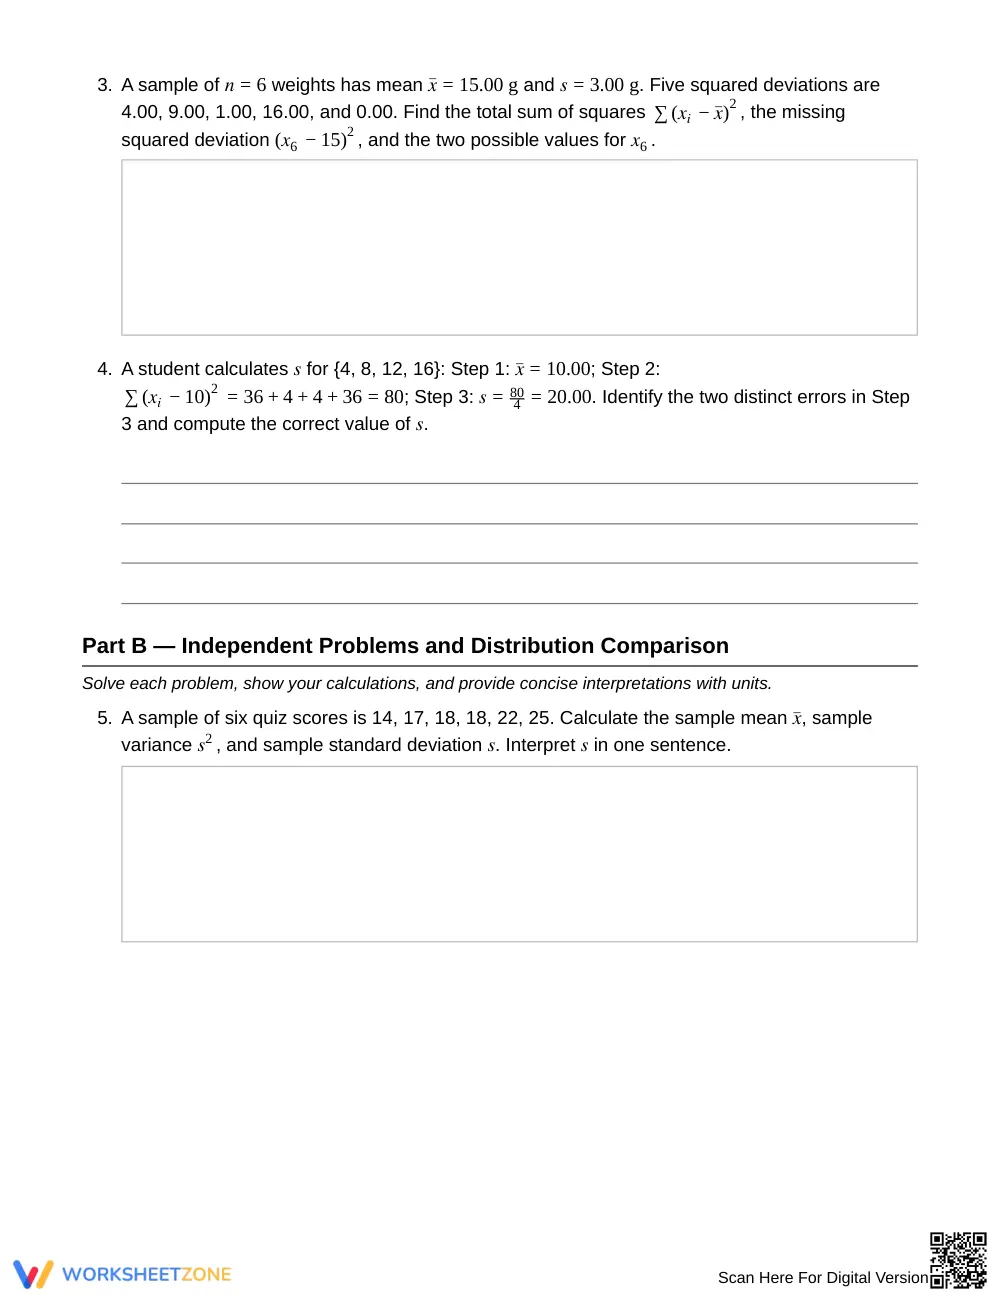
- Supported Practice (Part B, Problems 5–10): Applies calculations to real-world datasets, linear transformations, and comparative consistency evaluations.
- Independent Practice (Part C, Problems 11–12): Requires theoretical justifications regarding standard deviation properties and critique of advertising claims using distribution shape.
This sequence implements the gradual release of responsibility model to build arithmetic fluency and conceptual reasoning.
Standards Alignment
This resource aligns directly to standard HSS-ID.A.2: Use statistics appropriate to the shape of the data distribution to compare center and spread of data sets. It also supports HSS-ID.A.3 by examining outlier impact on spread. Both standard codes can be copied directly into lesson plans, IEP goals, or district curriculum mapping tools.
How to Use It
Assign after direct instruction on variance and standard deviation. Use Part A for guided partner work, transition to Part B for individual practice, and assign Part C as an exit ticket. When observing students, verify they divide by n − 1 rather than n for sample calculations. Expected completion time is 45 to 60 minutes.
Who It's For
Designed for Grade 12 Statistics, AP Statistics, and college quantitative reasoning courses. Built-in tabular templates support developing learners, while conceptual prompts extend advanced students. Pair this worksheet with an interactive dot plot or box plot comparison activity.
According to research highlighted in Fisher & Frey (2014), structured instructional sequences moving intentionally from guided scaffolding to autonomous problem solving significantly increase student retention of complex mathematical procedures. This Grade 12 Statistics resource embodies that pedagogical framework by targeting Common Core standard HSS-ID.A.2, which requires students to select and calculate appropriate measures of center and spread to compare quantitative distributions. By providing 12 rigorous tasks spanning tabular arithmetic, linear transformations, and conceptual justifications across 5 pages, the resource ensures learners build computational fluency alongside deep theoretical understanding. Students analyze how extreme values influence sample standard deviation, contrasting resistant and non-resistant statistics across varied contextual scenarios. The included 3-page complete answer key provides intermediate calculation steps and model explanations, giving educators a dependable tool for tracking advanced statistical mastery in secondary classrooms.


