




























Views
Downloads




Complete Residual Plots Worksheet | Grade 12 Statistics

Paste this activity's link or code into your existing LMS (Google Classroom, Canvas, Teams, Schoology, Moodle, etc.).
Students can open and work on the activity right away, with no student login required.
You'll still be able to track student progress and results from your teacher account.
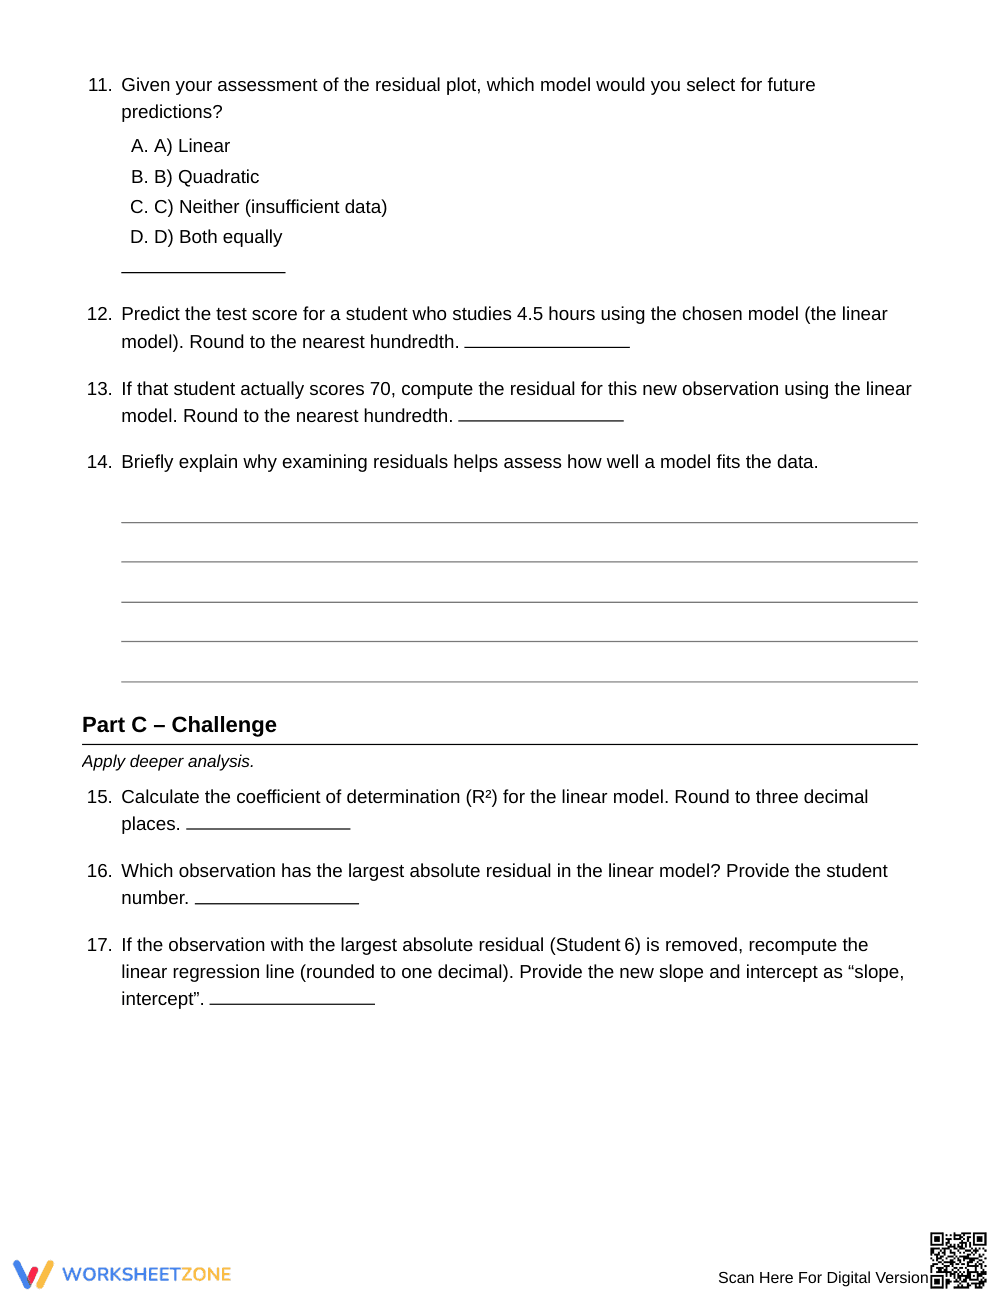
This Grade 12 statistics worksheet trains students to diagnose patterns in residual plots to evaluate regression models. Learners calculate residuals, compare linear and quadratic sum of squared residuals, and assess model fit. The targeted exercises build quantitative reasoning for advanced statistical decision-making.
At a Glance
- Grade: 12 · Subject: Statistics
- Standard:
HSS-ID.B.6— Represent bivariate quantitative data, fit functions, and assess fit using residual plots- Skill Focus: Diagnose Patterns in a Residual Plot
- Format: 5 pages · 18 problems · Answer key included · PDF
- Best For: Advanced placement and high school statistics practice
- Time: 45–60 minutes
What's Inside
This 5-page resource features 18 structured problems grounded in study hours and test score data. Students use a scatter plot and given formulas for residuals and sum of squared residuals (SSE). The set blends computational items, multiple-choice model comparisons, and graphical interpretation, accompanied by a 2-page answer key.
Skill Progression
- Guided Practice (Part A, Items 1–4): Students identify variables, compute baseline linear residuals, and determine point placement relative to the zero line.
- Supported Practice (Part B, Items 5–14): Learners calculate SSE across linear and quadratic models, identify residual curvature, and predict scores with subsequent error checks.
- Independent Practice (Part C, Items 15–18): Students determine R², identify high-leverage outliers, recompute regression parameters, and explain model limitations.
This gradual-release progression moves students systematically from guided calculation to independent diagnostic evaluation.
Standards Alignment
This worksheet aligns directly with `HSS-ID.B.6`: represent bivariate quantitative data on a scatter plot and assess model fit by analyzing residuals. In addition, `HSS-ID.B.6.A` supports fitting functions to context-driven data. Both standard codes can be copied directly into lesson plans, IEP goals, or district curriculum mapping tools.
How to Use It
Assign this worksheet after direct instruction on bivariate regression. During practice, check Item 10 to ensure students identify residual curvature rather than assuming linear fit from positive correlation alone. This 18-task resource fills a standard 45- to 60-minute instructional block effectively.
Who It's For
This resource supports Grade 12 students in AP Statistics, dual-enrollment, or advanced math courses. Provided formula headers support learners needing quick reference, while Part C extends analytical thinkers. Pair this worksheet with graphing calculator demonstrations or an anchor chart showing residual plot patterns.
Mastering residual diagnostics under standard HSS-ID.B.6 enables high school students to move beyond surface-level correlation metrics to evaluate genuine model appropriateness. When learners assess whether residuals display random dispersion or systematic curvature, they engage in authentic statistical reasoning that connects empirical observations to mathematical models. Research from Fisher & Frey (2014) demonstrates that structured gradual-release frameworks—progressing from guided computation through supported multi-model comparisons and independent analytical challenge tasks—significantly enhance skill retention and conceptual understanding in secondary mathematics classrooms. By guiding twelfth-grade students through explicit residual calculations, sum of squared residuals evaluations, and outlier influence analysis, this 18-task worksheet reinforces durable analytical mastery. Students learn why strong correlation can conceal non-linear patterns, preparing them thoroughly for college-level research environments and data-driven disciplines where rigorous residual diagnostics are essential for valid scientific inference.


