




























Views
Downloads




Complete Residual Patterns Worksheet | Grade 12 Statistics

Paste this activity's link or code into your existing LMS (Google Classroom, Canvas, Teams, Schoology, Moodle, etc.).
Students can open and work on the activity right away, with no student login required.
You'll still be able to track student progress and results from your teacher account.
This Grade 12 statistics worksheet trains students to evaluate regression model adequacy by distinguishing between random residual scatter and systematic patterns like curvature or heteroscedasticity. Learners analyze residual plots, compute residual sums of squares, and critique misleading correlation coefficients across 12 problems.
At a Glance
- Grade: 12 · Subject: Statistics
- Standard:
HSS-ID.B.6— Analyze residual plots to evaluate linear model fit- Skill Focus: Compare Random and Structured Residual Patterns
- Format: 5 pages · 12 problems · Answer key included · PDF
- Best For: Regression diagnostics practice
- Time: 45–60 minutes
What's Inside
This 5-page worksheet includes 12 diagnostic problems and a 3-page worked answer key. Students utilize a Diagnostic Rules reference box, inspect scatter displays, complete residual calculation tables, compare competing linear and quadratic fits, and explain theoretical regression assumptions.
Skill Progression
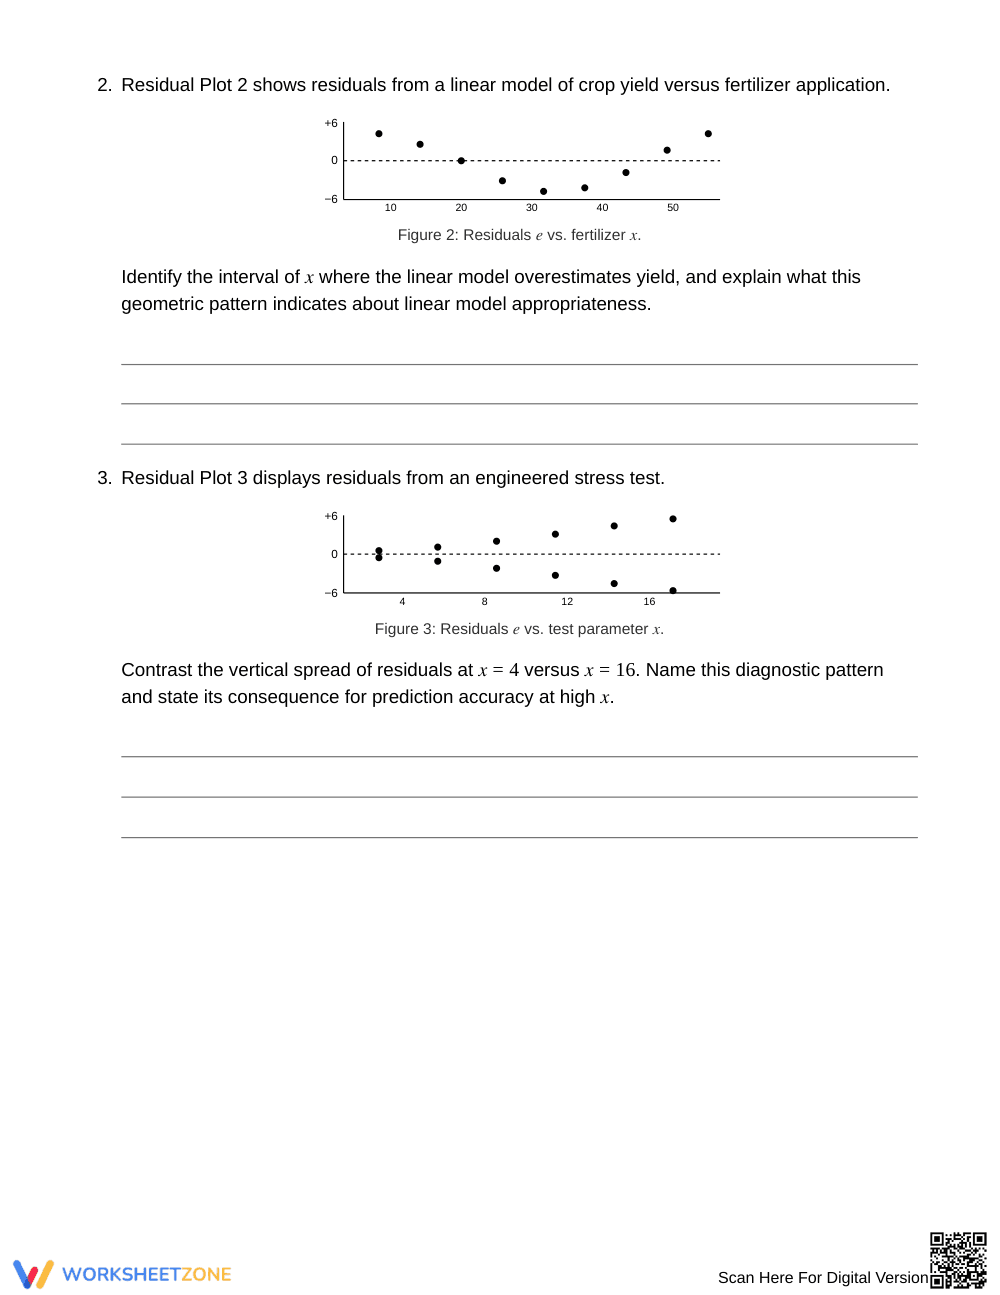
- Guided Practice (Problems 1–3): Students read residual plots directly to identify overestimation, underestimation, curvature, and fanning variance.
- Supported Practice (Problems 4–9): Learners calculate residuals, evaluate sum of squared errors, compare linear versus quadratic models, and examine high leverage.
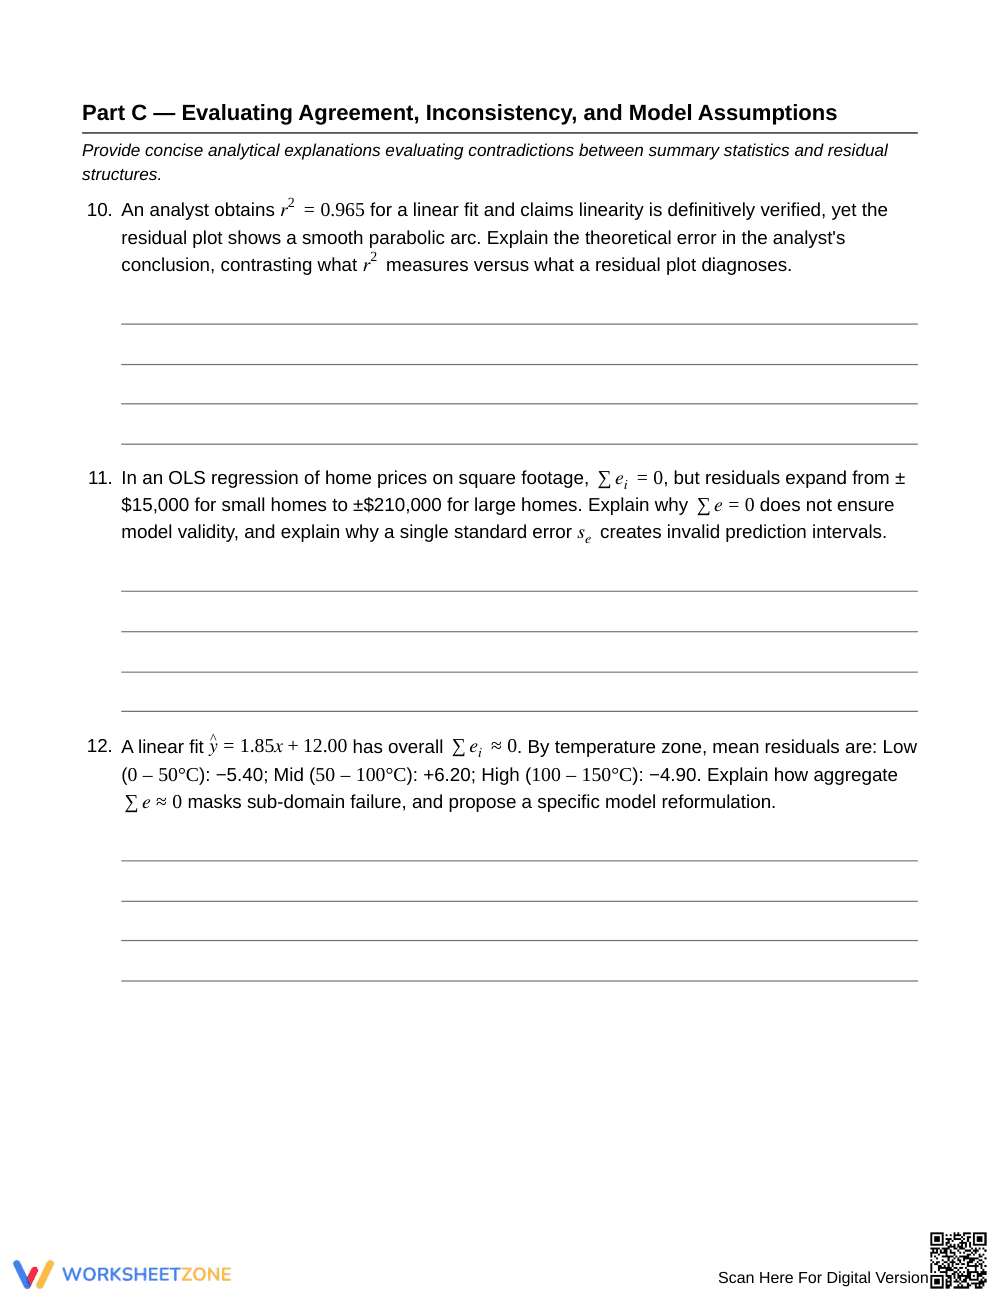
- Independent Practice (Problems 10–12): Students write analytical responses explaining why high correlation or zero-sum residuals do not guarantee linear validity.
This gradual-release structure builds foundational graphical interpretation before requiring high-level justification.
Standards Alignment
This worksheet aligns to HSS-ID.B.6, which calls for representing quantitative bivariate data on a scatter plot and assessing fit by plotting and analyzing residuals. It also reinforces HSS-ID.B.6.A through functional model evaluation. Both standard codes can be copied directly into lesson plans, IEP goals, or district curriculum mapping tools.
How to Use It
Assign this resource following direct instruction on regression residuals. Have students solve Part A and Part B with a partner, then complete the analytical prompts in Part C independently. Monitor student responses to Problem 10 as a formative check on leverage distortion. Expect 45 to 60 minutes for full completion.
Who It's For
Designed for Grade 12 AP Statistics or advanced mathematics courses, this resource supports students mastering bivariate analysis. Structured calculation tables assist learners needing computational guidance, while diagnostic prompts challenge advanced thinkers. Pair this activity with an anchor chart on residual patterns.
Targeting standard HSS-ID.B.6, this worksheet develops student ability to evaluate bivariate regression appropriateness by analyzing random versus structured residual patterns. Rather than treating residual calculation as an isolated mechanical exercise, the resource connects diagnostic scatter plots directly to underlying model assumptions, including homoscedasticity and structural linearity. According to research on structured cognitive scaffolding by Fisher & Frey (2014), gradual release instructional architectures significantly enhance student reasoning when transitioning from visual pattern recognition to complex mathematical justification. By prompting seniors to compute residual sums of squares, identify non-constant variance, and critique misleading correlation coefficients, the 12 problems reinforce conceptual rigor across secondary statistics curricula. Educators can readily utilize these diagnostic tasks to verify whether learners genuinely understand how residual geometry confirms or refutes ordinary least squares adequacy before advancing to non-linear model transformations and multivariate regression.


