































Complete pH Scale Analysis Worksheet | Grade 9-12 Science

Paste this activity's link or code into your existing LMS (Google Classroom, Canvas, Teams, Schoology, Moodle, etc.).
Students can open and work on the activity right away, with no student login required.
You'll still be able to track student progress and results from your teacher account.
This comprehensive high school science worksheet trains students to interpret the logarithmic pH scale through data tables, particle-level models, and titration curves. Learners calculate hydronium concentrations, analyze non-linear neutralization graphs, and evaluate common misconceptions using empirical chemical evidence to build quantitative reasoning.
At a Glance
- Grade: Grades 9–12 · Subject: High School Chemistry & Physical Science
- Standard: Interpret quantitative chemical data, concentration relationships, and neutralization curves
- Skill Focus: Logarithmic concentration analysis and titration curve interpretation
- Format: 4 pages · 27 problems · Answer key included · PDF
- Best For: Chemistry unit practice or assessment review
- Time: 45–55 minutes
What's Inside
The four-page printable worksheet includes reference data tables, a step-by-step titration curve model, and three structured sections. Students encounter multiple-choice items, power-of-ten concentration tables, particle-level reaction equations, and open-response justification prompts. A complete four-page answer key provides worked calculations and sample explanations for every task.
Skill Progression
- Guided Practice: Part A (Tasks 1–8) anchors students with a 25 °C reference table and formula box, asking them to classify household solutions and identify ten-fold factor shifts.
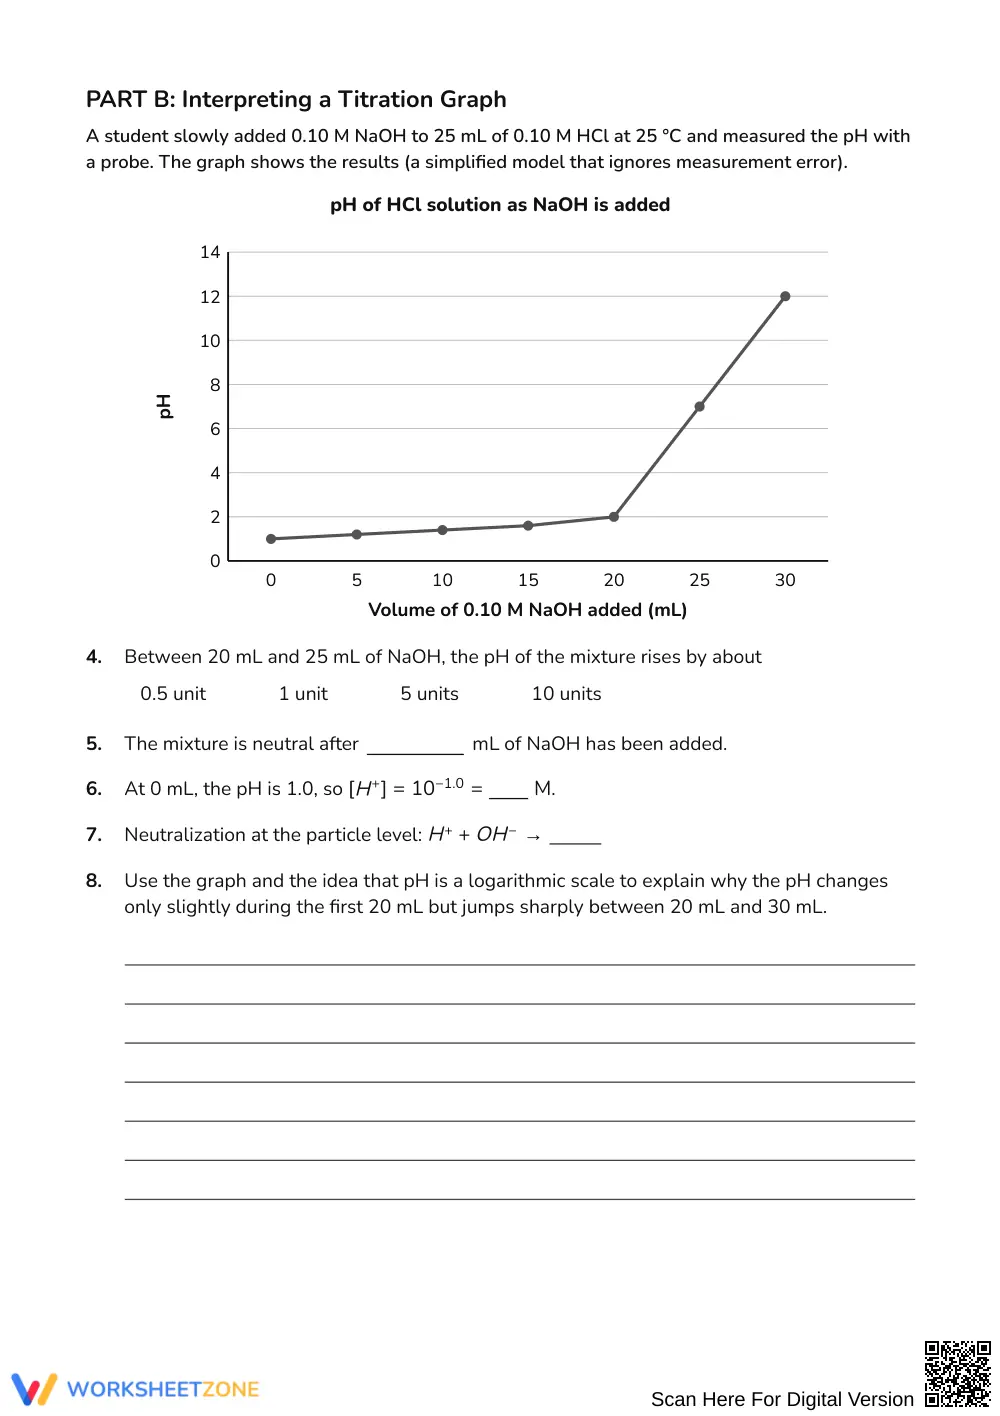
- Supported Practice: Part B (Tasks 9–18) guides learners through a 0.10 M strong acid-strong base titration curve, connecting particle neutralization to sudden logarithmic shifts near the equivalence point.
- Independent Practice: Part C (Tasks 19–27) challenges students to convert between pH and molarity, calculate hydroxide ion concentrations, and rigorously critique flawed student claims about pH ratios.
This gradual-release structure mirrors the I Do, We Do, You Do model, shifting students from guided table lookup to autonomous scientific argumentation.
Standards Alignment
This resource aligns with high school physical science and chemistry expectations for chemical reactions and solution equilibrium. Students model particulate interactions during neutralization reactions and calculate tenfold shifts in hydronium concentration across aqueous systems. Curriculum maps and lesson plans can reference these learning objectives directly for chemistry unit tracking.
How to Use It
Use Part A and Part B directly after introducing logarithmic scales and neutralization reactions to provide structured guided practice during class. Alternatively, assign Part C as a mid-unit formative check to evaluate whether students recognize that each unit drop reflects a ten-fold increase in hydronium ions rather than an additive change. Expected completion time spans 45 to 55 minutes.
Who It's For
This worksheet serves general chemistry, physical science, and introductory AP Chemistry students seeking rigorous quantitative practice. It pairs naturally with laboratory titration demonstrations, acid-base indicator investigations, and PhET acid-base interactive simulations.
Quantitative graph and evidence analysis in secondary chemistry demands that learners coordinate macro-level readings, symbolic formulas, and submicroscopic particle collisions simultaneously. This 4-page worksheet systematically reinforces the logarithmic definition of acidity across 27 progressive items, moving from household solution comparisons to titration curve inflection analysis and misconception critique. According to Fisher & Frey (2014), purposeful instructional sequencing that guides students from foundational modeling into independent claim evaluation significantly enhances conceptual retention and disciplinary problem-solving. By requiring students to calculate exponential concentration shifts, account for thermal energy release, and justify physiological pH sensitivity in human blood, this resource ensures secondary science students develop robust empirical reasoning and quantitative literacy for advanced laboratory chemistry coursework.


