





























Complete Molarity Data Worksheet | Grades 9-12 Science
Paste this activity's link or code into your existing LMS (Google Classroom, Canvas, Teams, Schoology, Moodle, etc.).
Students can open and work on the activity right away, with no student login required.
You'll still be able to track student progress and results from your teacher account.
This molarity worksheet guides high school science students to interpret evidence, link concentration to particulate representations, and analyze quantitative solution data. Across four structured pages, learners analyze calibration curves, particle diagrams, dilution sets, and thermal dissolution patterns to build conceptual and mathematical mastery of solution behavior.
At a Glance
- Grade: Grades 9–12 · Subject: High School Science
- Standard: Solution Chemistry — Interpret particulate models, calibration curves, and thermal dissolving data
- Skill Focus: Molarity calculations, particle modeling, and data interpretation
- Format: 4 student pages · 24 problems · Full answer key included · PDF
- Best For: Core chemistry instruction, lab follow-up, and inquiry review
- Time: 45–60 minutes of focused practice
What's Inside
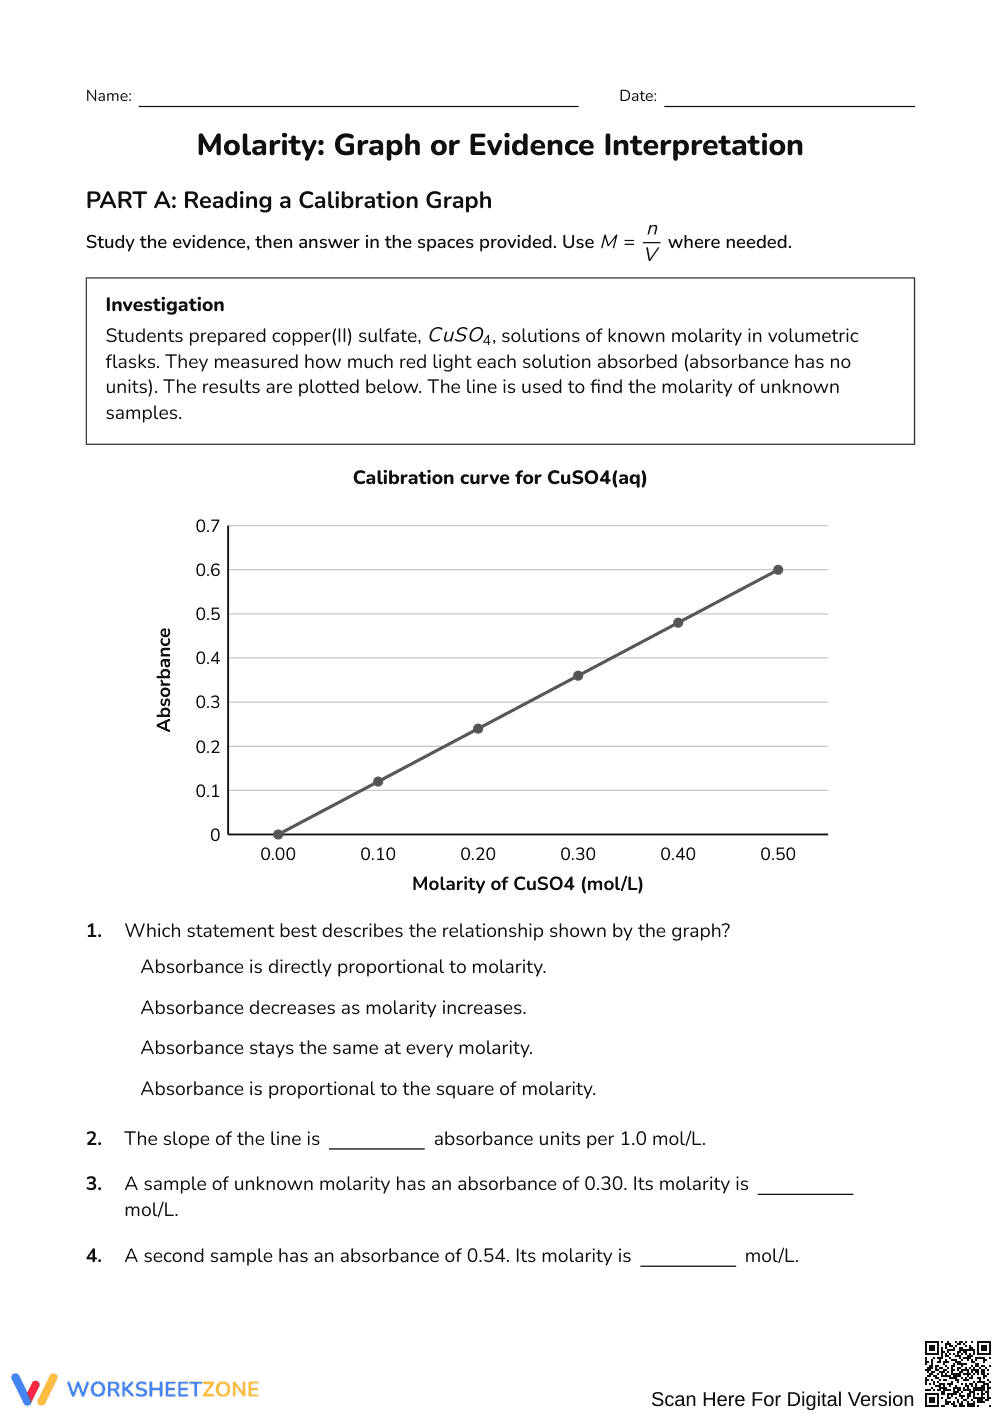
This 4-page resource contains 24 structured problems organized into four distinct investigations. Part A presents a spectrophotometric calibration graph with slope data for finding unknown concentrations. Part B uses particle diagrams to compare moles and volume. Part C tests dilution calculations using M₁V₁ = M₂V₂, and Part D evaluates calorimetry data to identify endothermic patterns. A complete 4-page answer key provides full explanations.
Skill Progression
- Guided practice (Tasks 1–6): Students read a calibration plot, use given slope values, and identify direct proportionality with teacher scaffolding.
- Supported practice (Tasks 7–15): Students interpret particulate dot diagrams and dilution tables, calculating concentrations and explaining solute conservation.
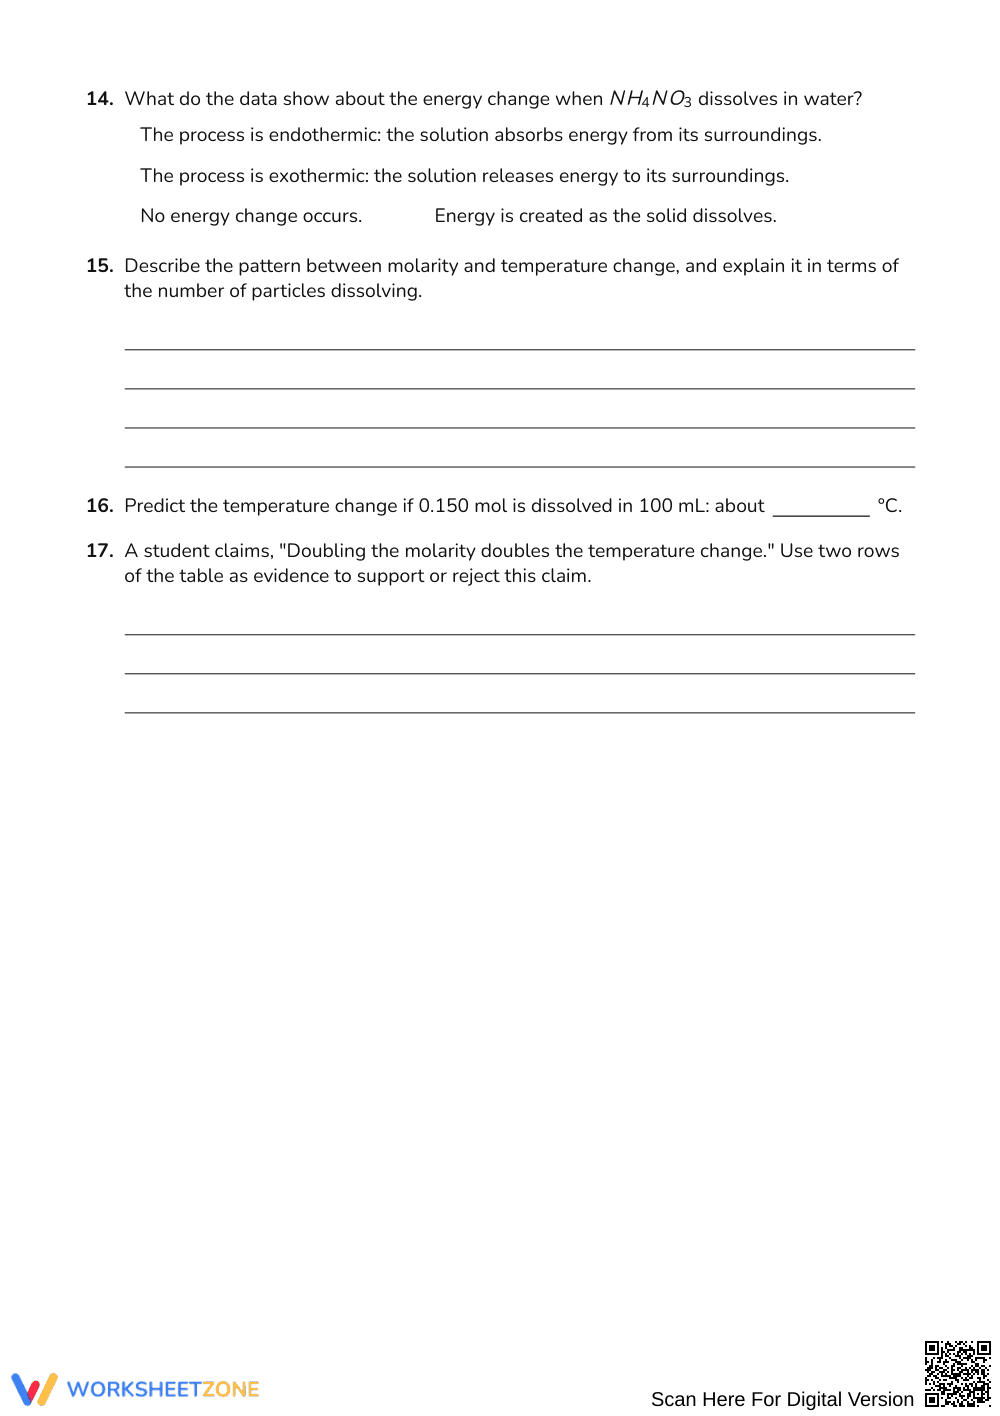
- Independent practice (Tasks 16–24): Students analyze dissolution calorimetry tables, predict temperature changes, and justify energy claims using empirical data.
This progression mirrors the gradual release of responsibility framework, transitioning learners from visual scaffolding to independent quantitative analysis.
Standards Alignment
This worksheet aligns with high school physical science standards for solution chemistry, requiring students to construct explanations from evidence for matter and energy interactions. Students relate macroscopic concentration to submicroscopic particle models. Both standard codes can be copied directly into lesson plans, IEP goals, or district curriculum mapping tools.
How to Use It
Use this worksheet after introducing molarity formulas or concluding an absorbance lab. To formatively assess understanding, inspect Part B responses; students often confuse solute particle count with concentration when volume changes. Expect 45 to 60 minutes for full completion in small groups or independent practice.
Who It's For
This resource serves general and honors high school chemistry students mastering aqueous solution concentration. Built-in visual particle models assist developing learners, while multi-step extrapolation and claim analysis challenge advanced students. Pair this activity with a physical copper sulfate dilution demonstration to connect abstract diagrams to observable laboratory evidence.
High school science instruction in molarity requires students to bridge macroscopic solution properties with particulate and mathematical representations. According to Fisher & Frey (2014), structuring instructional tasks around gradual release principles—moving from structured graphical analysis to independent evidence interpretation—significantly increases conceptual retention and quantitative competency in secondary science learners. This 4-page worksheet guides students across 24 rigorous problems to analyze spectrophotometric calibration lines, interpret submicroscopic dot diagrams of solute concentration, calculate volumetric dilutions, and evaluate thermodynamic temperature changes during dissolution. By integrating quantitative calculations with qualitative particle reasoning, the resource directly supports mastery of solution concentration and matter conservation across multiple levels of representation. Educators can utilize the comprehensive 4-page answer key to quickly evaluate student progress, pinpoint misconceptions regarding volume versus particle quantity, confirm calculation accuracy, and document measurable growth in scientific reasoning across standard secondary chemistry curricula.


