






























Complete Inference Check Worksheet | Grade 12 Statistics

Paste this activity's link or code into your existing LMS (Google Classroom, Canvas, Teams, Schoology, Moodle, etc.).
Students can open and work on the activity right away, with no student login required.
You'll still be able to track student progress and results from your teacher account.
This comprehensive 4-page worksheet guides Grade 12 Statistics students through one-sample proportion confidence intervals and hypothesis testing. Students calculate sample proportions, verify large-count conditions, compute test statistics, interpret p-values, and compare theoretical models to empirical simulations across 16 rigorous tasks. It delivers structured statistical practice that bridges foundational formula mechanics and conceptual data interpretation.
At a Glance
- Grade: 12 · Subject: Statistics
- Standard: Understand and calculate statistical inferences for population proportions
- Skill Focus: One-Sample Proportion Inference
- Format: 4 pages · 16 problems · Answer key included · PDF
- Best For: AP or introductory statistics inference review
- Time: 45–60 minutes
Inside, educators will find a formula reference header containing standard error, z-score, and confidence interval equations, followed by a three-part problem sequence spanning 4 student pages. Tasks include short definitions, algebraic computations, multiple-choice probability evaluations, contextual hypothesis decisions, and simulation-based distribution analysis. A full 2-page answer key provides complete numerical solutions and written response models.
Skill Progression
- Guided Practice (Part A, 4 problems): Scaffolds foundational concepts with key formulas to define sample proportions, check normal approximation conditions, and calculate expected counts.
- Supported Practice (Part B, 8 problems): Guides learners through standard error computation, confidence interval construction, hypothesis testing, p-value analysis, and context interpretation.
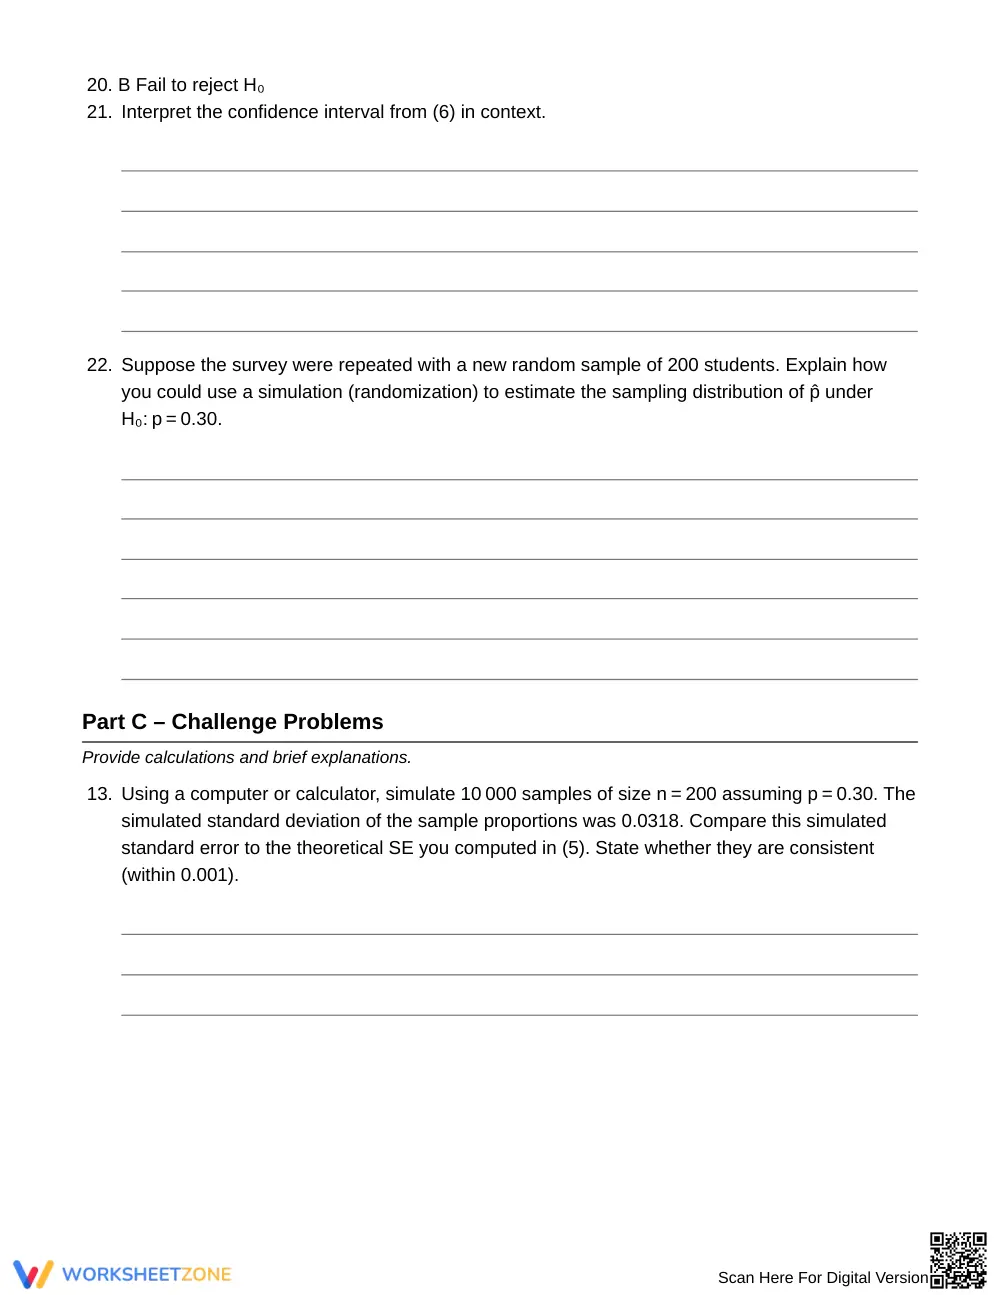
- Independent Practice (Part C, 4 problems): Challenges students to analyze 10,000-sample computer simulations, compare empirical percentiles to theoretical margins of error, and evaluate real-world claims.
This structured gradual-release design moves students from direct formula recall to advanced evaluative reasoning.
Standards Alignment
This activity focuses on constructing confidence intervals and conducting significance tests for population proportions using sample data and normal approximations. Students evaluate randomization distributions against theoretical standard errors to make sound statistical decisions. Both curriculum standards and learning objectives can be copied directly into lesson plans, IEP goals, or district curriculum mapping tools.
How to Use It
Deploy this activity after direct instruction on one-sample z-procedures to solidify procedural fluency and conceptual understanding. Alternatively, assign Part C as a collaborative lab investigation during computer-based simulation modules. For formative assessment, inspect students' condition checks in Part A to catch common misconceptions regarding expected counts before they calculate test statistics. Typical completion time ranges from 45 to 60 minutes.
Who It's For
This resource is designed for Grade 12 AP Statistics or introductory college-level statistics students tackling formal inference. Scaffolded formula boxes support emerging learners, while open-ended simulation questions provide rigorous extension for advanced students. Pair this worksheet with an interactive sampling distribution applet or a summary anchor chart on hypothesis testing decision rules.
According to findings highlighted in EdReports 2024, secondary mathematics materials demonstrate the greatest impact when conceptual understanding and procedural fluency are developed in tandem through structured data analysis. This Grade 12 Statistics resource embodies that instructional principle by leading students through 16 structured tasks covering one-sample proportion inference, normal approximation conditions, hypothesis testing, and simulation comparison. By combining explicit formula scaffolds in introductory sections with open-ended margin of error evaluations in advanced tasks, the worksheet reinforces essential quantitative reasoning habits. High school students learn not only how to calculate test statistics and confidence intervals mechanically, but also how to interpret p-values and sampling distributions within authentic survey contexts. Educational research confirms that integrating empirical simulation comparisons alongside standard algebraic procedures significantly strengthens student retention and conceptual mastery in high school statistical inference units.


